
So You Think The Yield Curve Inversion Spells Doom For The Economy?
It’s not the way bulls desired the week to end, especially after a strong Thursday performance, but when algorithms kick into high gear, they generally work toward extremes. The S&P 500 (SPX ) was up for most of the week and had broken above 2,850, but that was before the German bund fell into negative yield status and subsequently found a global flight to safety in bonds. The flight to safety and risk-off sentiment pervaded European and equity markets last Friday.
Despite Friday's sell-off, the S&P 500 closed down only 0.77% for the week. The index is still up 11.7% year-to-date, but we’ll have to wait and see what lay in store in the coming weeks and if the S&P 500 can remain above its 200-DMA. For the past trading week, the expected weekly move was $33/points and the S&P 500 breached just slightly above the expected move on Thursday and before the sharp pullback began. This past week also represented the 1st week within the last 3 weeks that the index finished within the weekly expected move.
With the VIX gaining nearly 21% on Friday, finishing the week at 16.48, this coming week’s expected move has greatly increased from the previous week.
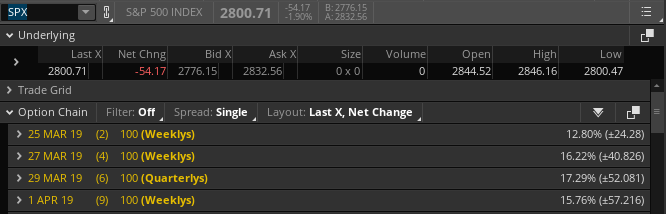
In the coming week, options are pricing in a weekly expected move of roughly $52/points for the S&P 500. This begs the question as to how the market will open after such a dramatic sell-off on Friday and the yield curve inverting. What caused the inversion you might be asking? There’s no one cause, but make no mistake about it, the subject was all the media craze on Friday.
German Contagion
In the pre-market hours on Friday, German manufacturing data spilled out into the trans-Atlantic equity markets in a major way. IHS Markit’s PMI survey published Friday revealed that Germany’s manufacturing sector contracted for the third consecutive month in March, with output growth nearing a six-year low.
Meanwhile, data from Germany’s federal statistics office (Destatis) in February showed that the country narrowly avoided a recession in the fourth-quarter of 2018, with the economy growing 0.0% from the previous quarter. Adding to the slowdown in Germany is the uncertainty surrounding Britain’s exit from the European Union. In the latest, the European Union agreed to an extension to the date of the U.K.’s withdrawal from the bloc but said the length of the delay would depend on whether Parliament approves Prime Minister Theresa May’s Brexit deal next week.
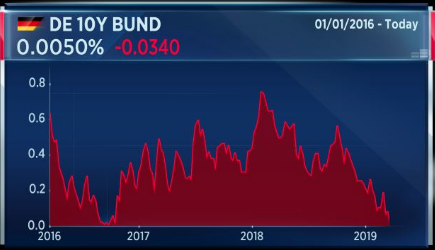
A plethora of negative economic data out of the Eurozone’s largest economy coupled with Brexit risk served to send the German Bund into negative territory, spurring yields lower in U.S. Treasuries. To make matters worse for U.S. corporations, the weakness in Germany resulted in weakness in the Euro that consequently sent the U.S. Dollar (DXY) soaring Friday, recapturing all it had lost from the FOMC meeting on Wednesday.
Yield Curve Inverted
Since it is all that everyone will be talking about for the coming days and possibly weeks, let’s dive into the subject with some education points and before looking at historic S&P 500 market performance statistics. Firstly, the main part of the yield curve inverting that everyone will point to is the 10-year Treasury note yield and the 3-month Treasury note yield. And why is it the most relevant part of the curve market participants are concerning themselves with, well because it’s the one the FOMC pays most attention to or is assumed to pay most attention.
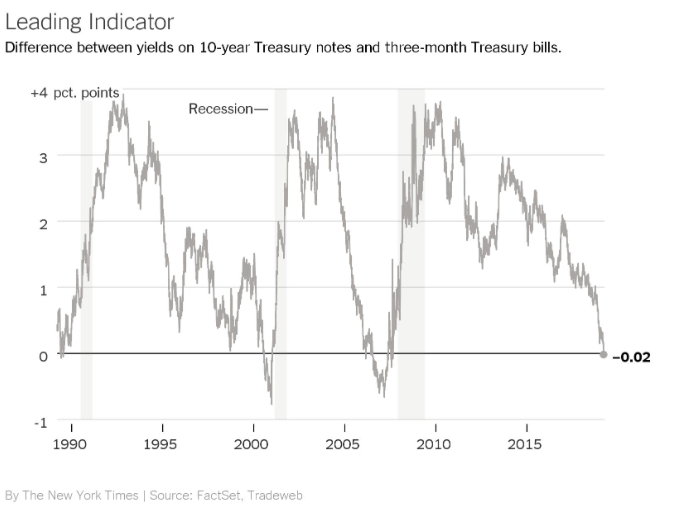
The 3-month/10-year inversion has been the most reliable signal of future recession. Inversions of that spread have preceded each of the past 7 recessions, including the 2007-2009 contraction, according to the Cleveland Fed. They say it’s offered only two false positives, an inversion in late 1966 and a “very flat” curve in late 1998. With that said, we’re going to get into why this inversion is not the inversion that affects the economy by and large, but rather must satisfy a self-fulfilling prophecy within sentiment in order to signal a recession.
One of the main reasons yield inversion may not be a recessionary leading indicator as it has been in the past is largely due to central bank influence and participation in the bond market since the Great Financial Crisis and European Debt Crisis. The reality is, this time is truly different because there is a player in the bond market that had not been there previously (to this degree), and they are a big player; the central banks.
Economist Ryan Sweet of Moody’s Analytics suggests that bond yields simply can’t be relied upon as a recessionary forecaster due to this very important factor, which has served to sustain pressure on rates for nearly a decade. Sweet and his team think the economy is slowing, but recession risks remain low.
Most recessions occur due to excess or imbalances in the economy and assets. Do we have a housing bubble like 2007 or a bubble in the stock market without representable revenues like 1999? No, neither exists today and revenues are still expected to grow some 4.5-5% in 2019. Have we had sub-4% unemployment and low inflation in the past leading into a recession? The answer is no to both. Having said that, a recession isn’t impossible, it’s just less probable given the current state of the economy.
“We’ve muddled along. We never got too hot — if anything, inflation is too low.”
Sweet says the pivot by the Fed is a good thing. “Far from fearing a slower economy, the Fed engineered it. Once the fiscal stimulus faded, the economy could not continue to grow at 3% without overheating. Bringing growth back down to 2% will allow the expansion to live on.”
As it pertains to the yield curve inverting, we can’t help but to reiterate that when a new and significantly behemoth player in the bond market comes along, it creates distortions. The long-end of the yield curve (10-year Treasury) has been bid up over the last several years as part of global quantitative easing programs. As such, it never had the ability to find sustainable sellers of bonds, thus suppressing yields. Under this dynamic, longer-dated maturities/bonds have been within arms reach of shorter-dated maturities/bonds for a prolonged period. This increases the odds of inversion once QE ends and as expansion cycles become extended. As many view a 10-year expansion cycle to be long in the tooth, they naturally diversify out of risky assets and into safer assets such as bonds, thus forcing yields lower, even if a recession isn’t at-hand. To this point Sweet offered the following:
“I’ve always been told not to bash the yield curve, but I’m bashing it. People who hang everything on the yield curve “have correlation and causation mixed up. An inverted yield curve typically reflects recessionary conditions, but doesn’t cause them.
The slope of the yield curve is “sending a false signal,” he says. Because so many Treasurys are held by central banks, the 10-year yield can no longer be seen as market-determined. Quantitative easing is having a big influence on the price of bonds. That was the whole point of QE.”
And once QE ended in late 2014, the front end of the bond curve was freer to behave as it tends to, with lending institutions selling the front end of the yield curve in favor of longer-dated bonds/maturities.
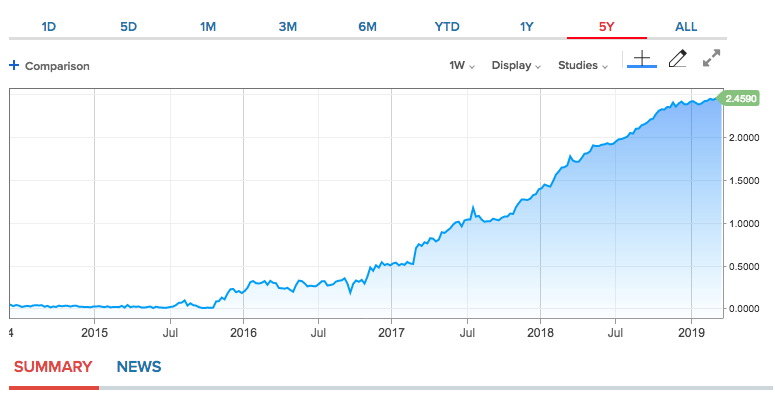
Absent a recession or QE, the 3-month Treasury yield only goes in one direction over time, higher (See chart above). And that’s what we had, the end of QE, which unleashed selling at the front end. But the 10-year Treasury yield goes in the opposite direction over time, regardless of economic conditions and never found its typical expansion cycle distance/spread from the 3-month Treasury due to QE. It's one of the reasons this time, in deed, is different and even if the outcome invariably doesn't prove to be so.
Most importantly when dissecting yield curve inversion, is how it relates to bank activity and why it MAY lend itself as a recessionary signal. The yield curve drives lending and money availability. When it inverts it causes banks to cut back lending, raise credit lending standards, which can cause stress in the credit markets. And that’s where we need to go to next to see if there has been stress in the credit markets. After all, the yield curve has been flattening for several months. If stress is occurring in the credit markets, it’s likely that the equity market panic was warranted on Friday because stress in the credit market will lend itself to curtailing lending practices and an eventual seizure of credit/lending. (Chart from Ari Wald of Oppenheimer & Co.)
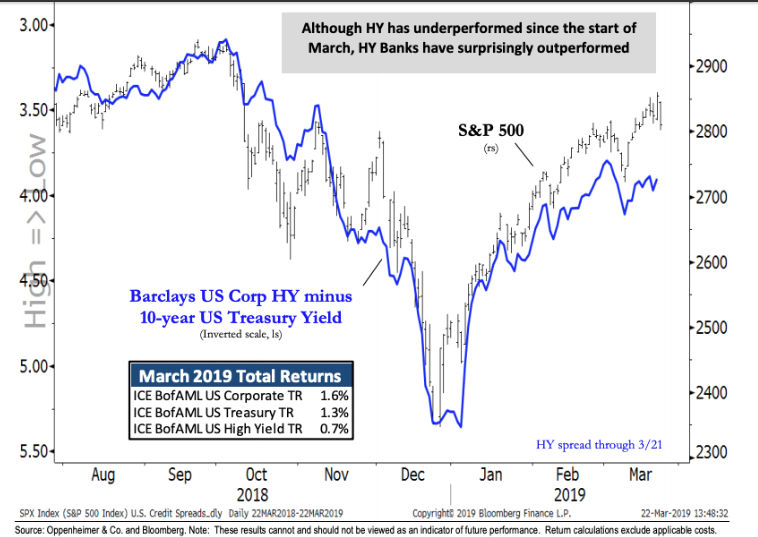
Based on the lucid chart above from Ari Wald, there are no signs of credit stress in the major indicators. This evidences the thesis that algorithms latched onto the German bund turning negative on Friday, which created a technical move in U.S. bond and equity markets. Wald goes on to state the following with respect to analyzing the credit markets:
“The cautionary drop in interest rates isn’t being confirmed by signs of major stress in high-yield credit spreads either, by our analysis. While high yield has underperformed both Treasuries and corporate bonds in March, weakness hasn’t been meaningful in relation to the year-to-date outperformance going into this March peak; i.e., it’s been within trend, in our view. It’s also interesting to note that while banks have been a key underperformer in the equity market since the start of the month, the industry has surprisingly outperformed within the high-yield market.”
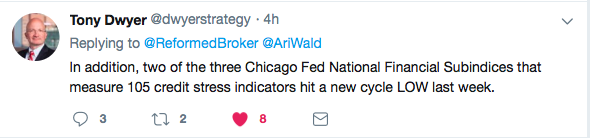
In fact, for the month of March, high-yield bonds issued by banks are the top total return performing credits, still up 1.8% in March versus the return for the entire high-yield index of just .7 percent. So if you thought people were selling assets out there because they think there’s some fundamental issue with the economy or the financial system... there’s simply no logic to be found in that conclusion. Want more logic, most Chicago Fed National Financial Sub indices that measure credit hit a new cycle low just last week accord to Canaccord Genuity’s Tony Dwyer.
A final point on the stress in the markets and possibly an indicator as to whether or not this is another “buy the dip opportunity” in the making given the yield curve inversion. If we are looking at the yield curve as a signal of stress in the financial system and potential recession indicator, we should also look at swap spreads, namely 2-year swaps. The 2-year swap spreads are arguably an important barometer of systemic risk and liquidity conditions and at times a leading indicator of economic health. In the following chart, one can see that swap spreads rise during market stress, as they did in the Q4 2018 period. But look at where they are today.
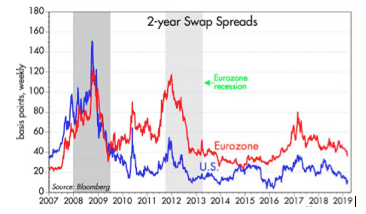
Today, U.S. swap spreads are extremely low and in the Eurozone, they have declined to levels (~36 bps) that are approaching a zone of normalcy, despite German economic data. Still can’t find credit stress or financial market liquidity systemic risk build-up in the system. It doesn’t mean it can’t come quickly, but it’s not within present conditions.
Moreover, Quantitative Easing (QE) has forced economists to revisit and potentially revise their understanding of the yield curve as a recessionary signal. That revisiting is not absent the FOMC either. In 2018, the Fed released notes on how it is forced to look at the yield curve given the affects of QE.
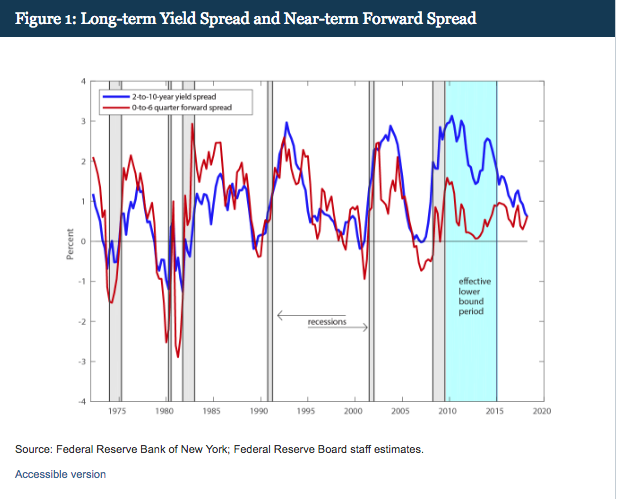
Defining Near-Term Forward Spreads
“Like a standard term spread measure using yield to maturity, a forward spread gauges the slope of the Treasury term structure. However, using forward rates should help identify more precisely than yields where on the maturity spectrum the signal for recession lies.3 The forward rate at a given maturity can be thought of as a gauge of the market's expected short rate at that horizon, plus a term premium. On the other hand, because a bond's yield is an average of the forward rates over the term of a bond, yields tend to dull the signal embedded in forward rates. The near-term forward spread we focus on is the difference between the current implied forward rate (on Treasury bills) six quarters from now and the current yield on a three-month Treasury bill, plotted in red alongside the long-term yield spread in Figure 14. Arguably, changes in this forward spread should be driven largely by changes in the market's expectations for the path of interest rates set by monetary policymakers over the next six quarters, departing from this only to the extent of fluctuations in term premiums on shorter-term Treasuries.”
Today, the Fed lends almost no significance other than sentiment to the 3-10 year Treasury yield inversion, as a recessionary signal. In other words, sentiment will need to overcome fundamentals in order to create a self-fulfilling recession.
Regardless of the facts, sentiment can create market turbulence that lends itself to a future recession and/or a bear market. So let’s look at some helpful statistics with a yield curve inversion occurrence.
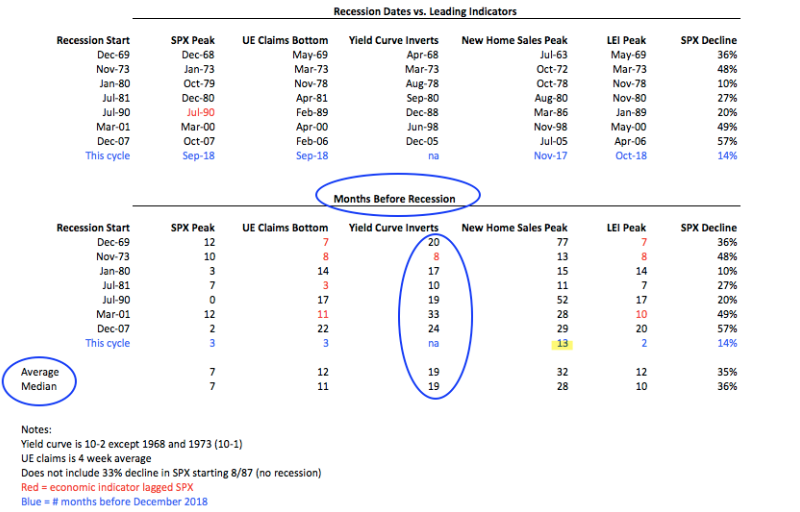
In the table above, it’s clear that the average time between a yield curve inversion to a recession is roughly 19 months. That is seemingly a long ways off from today. We’ve only had one day of inversion thus far, and it might not last long. But just in case, let’s take a look at what happens when the yield curve stays inverted for 10 straight days. This data comes to us from Bianco Research.
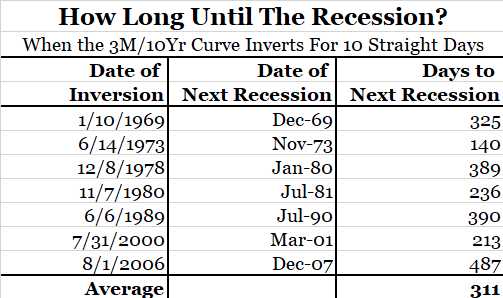
From a statistical and historic perspective, let’s hope this inversion doesn’t last 10 days, as historically it would prove to move a recession closer to occurrence.
Economic Data & China Stimulus
Economic data continues to roll in rather mixed, but increasingly more favorable and expressing a mid-year rebound in the making. Existing-home sales ran at a 5.51 million seasonally-adjusted annual rate in February and up 11.8% from the prior month, the National Association of Realtors said Friday.
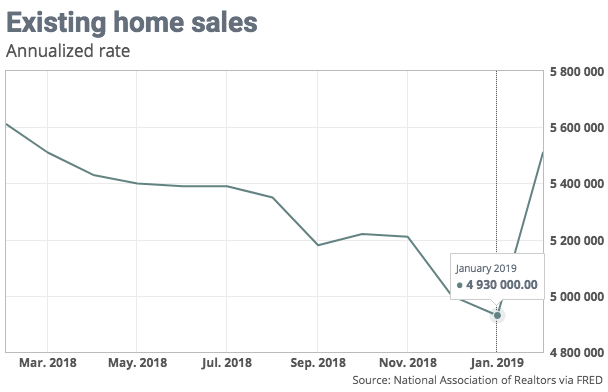
With mortgage rates hitting a 13-month low, buyers flooded the housing market. The MoM increase was the biggest since December 2015. The February pace of sales was 1.8% lower than a year ago, and the median sales price during the month was $249,500, 3.6% higher compared to a year ago. With median price increasing more so than mortgage rates dropped, this continues to prove that affordability is not the problem, it’s inventory and shifting household formation demographics.
Alongside some aspects of the housing sector ticking higher in February, the Philadelphia Fed business activity index rebounded in March to a seasonally adjusted reading of 13.7 from – 4.1 in the prior month. The gain reverses most of the steep 21.1-point plunge in February.
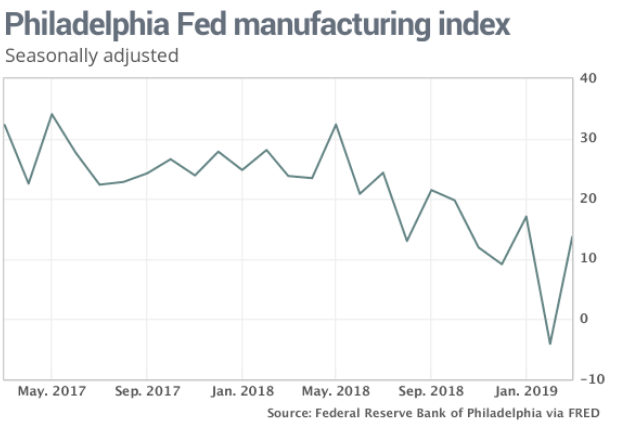
The rise in the Philly Fed Index is a feather in the cap for bulls, even though bears will point to the sharp decline for new orders in the 6-month forecast. (See chart below)
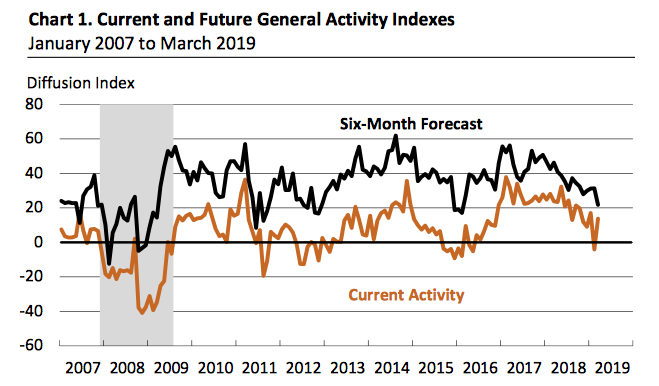
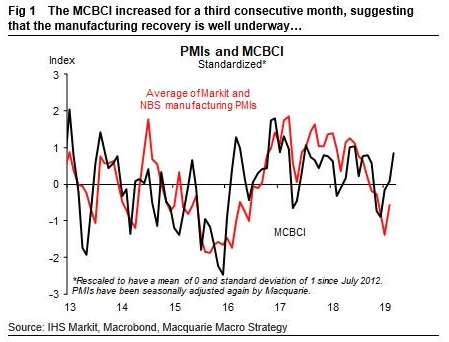
The future outlook is at its lowest level since 2016 and right before trending higher and post the China hard landing scare. And speaking of China, we are already starting to see some green shoots turn into bamboo stalks in the regional economy. It’s unlikely that a true turnaround will be realized in the broader economic data until mid-year, but some economic data has ticked higher, including PMIs and Credit.
With Chinese authorities moving to stimulate the economy through tax cuts and monetary policy easing, China’s economy has started to show “some green shoots,” said Roach, who’s a former chairman of Morgan Stanley Asia.
“I think the economy will begin to move up in the second half of this year — somewhere in the 6 percent zone.”
Piggy-backing on what Roach offered, Chi Lo of BNP Paribas Asset Management says he sees "green shoots" in China's property market and economy. He says the rebound in real estate investment was "spectacular."

Recall also that the Peoples Bank of China (PBOC) has significantly lowered the Required Reserve Ratio for large and small banks by 2.0% since October after announcing the fifth reduction in the past year. The reductions in the past year from 17.5% to 13.5% represent a drop of 22.8% almost twice as large as the easing in 2014 and 2015. In response to the PBOC’s easing, the yield on China’s 10-year bond has fallen from 3.70% in late September to 3.18% at the end of February.
The January improvement in Total Social Financing is the largest increase since the PBOC’s response after the 2008 financial crisis. The easing of monetary policy and increased flow of credit has led to an upward reversal in fixed asset investment and, if continued, would help stabilize China’s economy in the short run and lead to a firming as 2019 unfolds.
Now let’s put some of the pieces together by recalling the latest disturbing PMI data out of Germany, with respect to China’s economy. The largest customer for Eurozone goods and services is China. As China’s economy improves it will thus improve the Eurozone economy that is led by the German economy. The slowdown in China and the subsequent drop in demand for German goods is one of the main reasons why manufacturing in Germany tumbled so much during 2018 and into the first quarter of 2019. With a still strong service sector in Germany if China continues to improve by mid-year, Germany and the Eurozone economy with improve as well. Of course, the match that lights this candle ablaze may very well be a trade deal between the U.S. and China. Negotiations between the two nations will carry on this weekend and find an early April meeting in the U.S. between President Xi and Donald Trump.
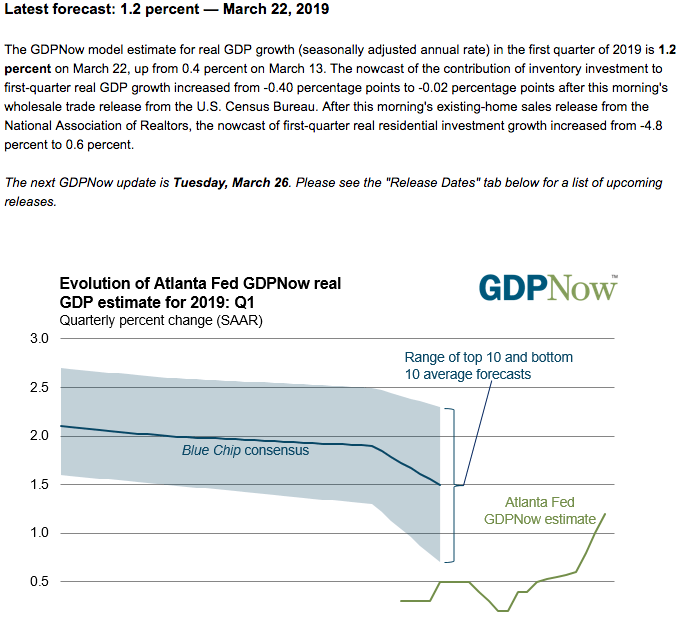
As it pertains to the U.S. economic outlook, which will likely find itself correlated to some sort of U.S./China trade deal, forecasts for Q1 GDP have risen after certain of the weekly economic data. The Atlanta Federal Reserve took its Q1 GDP forecast significantly higher on March 22, 2019.
There is no U.S. economic data set to be released on Monday, but there is a litany of economic data that will find a good deal of attention thereafter, this coming week. Before we can even get a peak at Q1 2019 GDP, we’re going to get a 2nd look at Q4 2018 GDP, which is expected to cool from the original 2.6% growth print. Finom Group is of the opinion that Q4 2018 GDP will be finalized at roughly 2.3% when it is all said and done. Additionally, Consumer Confidence and Sentiment readings will roll in this coming week. Chicago PMI and the Fed’s favorite inflation gauge, Personal Income and Consumer Spending (PCE), will round out the week. As PCE continued to cool in January, it provided the impetus for the FOMC to put rate hikes on hold for the foreseeable future.
Buybacks
Earnings season is fast approaching and as such, the notion of how buyback blackout periods will affect the overall market has reared its ugly head. We characterize it this way largely because of the lack of liquidity in the market place since late 2018. For an understanding of the SEC rules that govern share repurchases by corporates and executives, understand that the rules were created to remove liability from corporations while adding a layer of public disclosure for public market participants.
- Rule 10B-18 reduces liability for companies and their affiliated purchasers when the company or affiliates repurchase the company's shares of common stock.
- In 2003, the SEC amended the rule, requiring companies to disclose more detailed information on share repurchases on forms 10-Q, 10-K and 20-F.
- Despite the safe harbor provision, the company must report repurchases in compliance with the various regulations.
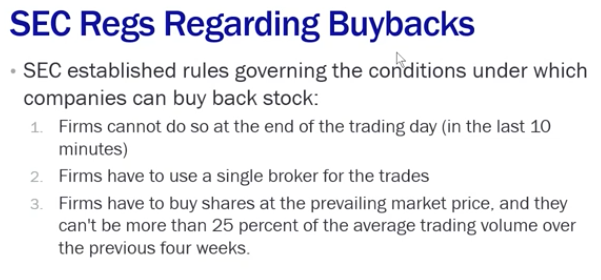
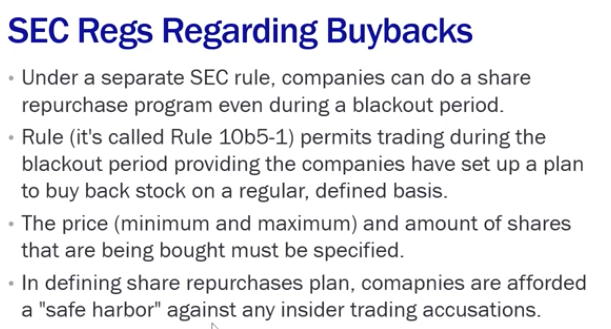
Market participants have largely been under the impression and found with the understanding that there is an SEC-regulated blackout period for corporations. The reality is that there are only 3 real rules offered by the SEC. We suggest the term “offered” because the SEC rarely has ever levied a case against any buyback program. Here are the 3 rules governing buybacks.
The key to avoiding any SEC violations regarding share repurchases is simply for the corporation or the corporate executive to provide a share repurchase plan.
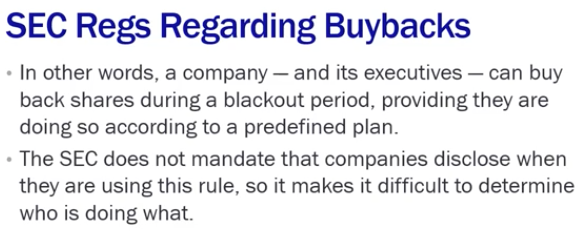
So here comes the funny part or the disturbing part of the SEC rules concerning blackout periods and/or share repurchase programs. In the bullet points below, one can see that the SEC does not mandate that companies disclose when they are using rule 10b5-1. Can you believe that? It’s basically saying, “Here’s some rules we want you to follow, but because we have no real way to track, regulate and levy penalties we’re forced to institute an Honor System.
The fact is that most people have limited to no understanding about the rules regarding buybacks. Why is this you might ask? It’s largely due to herd mentality. Nobody wants to be accused of insider trading and corporations simply move the liability of executing share buyback programs onto broker-dealers. Because the SEC has only raised a couple of concerns since 1983 on the subject matter, everyone simply assumes the rules are hard and fast instead of considering there is quite literally every existing loophole in the SEC rules that basically make it possible for share buybacks to happen at any time and without the threat of penalty.
Nonetheless, here is the most popular share buyback chart going around the investor community.
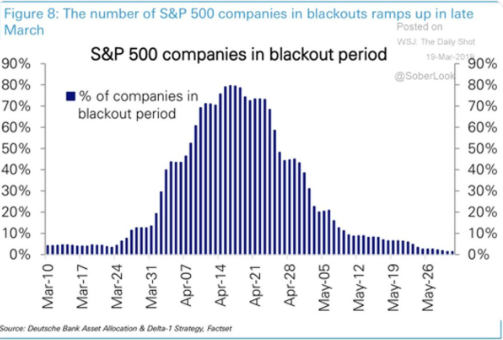
The chart comes from Deutsche Bank… of course, it’s Deutsche bank right, because they have a stellar reputation? Moreover, do you notice the simplicity of the time frame the bank is using to outline the concept that some 75% of companies will be in a blackout period starting this coming week and through mid-April? That’s right, it’s not a YOY or even a multi-year chart. It’s basically a snapshot of the next month or so, no historical data. We call this an assertion or an opinion that Deutsche Banks wants to be deciphered as fact and without correlated, historical context. They offer no basis of reality on how corporate buyback plans work or the fact that the notion of a blackout period is only a notion of sentiment and has no reference to any SEC rule.
We have seen reports that quarter-end rebalance effects will be made worse by the buyback ‘blackout’ period that starts ~1 month before earnings season, i.e., end of March. This is simply not the case, as individual companies enter blackout periods not ahead of the beginning of the earnings season, but ahead of their own reporting date. This puts the peak blackout period in mid- to late April, rather than late March, according to J.P. Morgan Chase’s Marko Kolanovic.
In keeping with Kolanovic’s factual representations, we are also forced to recognize that the herd has spoken and for years. There is a natural period of share buybacks that do ease during earnings season, but it’s not a rules-based activity, just tradition!
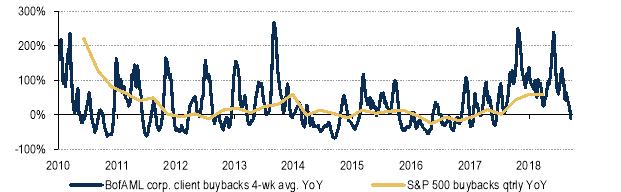
In the chart above, Bank of America Merrill Lynch identifies that that buyback activity among its clients has slowed sharply lately. So while we have lay to rest some of the nonsensical notions surrounding blackout periods, it doesn’t mean the traditions that have taken root since the 1980s haven’t created a natural liquidity crunch in the market during earnings season. We’re losing a buyer of equities folks, regardless of reason and that has a negative liquidity affect. Given liquidity, it is plausible that just short covering, buybacks, dealers’ gamma hedging, and some limited re-leveraging drove the entire recovery in equities thus far in 2019. On the other hand, should re-leveraging take hold, this could produce further upside in the market later this spring according to Marko Kolanovich.
Hedge funds’ equity exposure is very low, and systematic investors are largely underweight. The volatility targeting community (including insurance products, platforms, dealers’ products, and other asset managers) is likely in the ~25th percentile of their equity exposure range, CTAs are net short equities based on their beta (equity exposure in 10th percentile), and HFR global HF index beta is below its 10th percentile. J.P. Morgan’s prime brokerage business reports net equity exposure in its ~36th percentile. We often ask who is buying the market and forgo the practice of asking who’s left to sell?
Earnings Outlook & Fund Flows
For the Q1 2019 earnings period, estimates continue to moderate lower. FactSet now anticipates an earnings decline of 3.7% for the Q1 period, down from a 3.6% expected decline just a week ago. The estimated earnings decline for Q1 2019 is -3.7%. If -3.7% is the final decline for the quarter, it will mark the first time the index has reported a year-over-year decline in earnings since Q2 2016 (-3.2%) and the largest year-over-year decline in earnings since Q1 2016 (-6.9%).
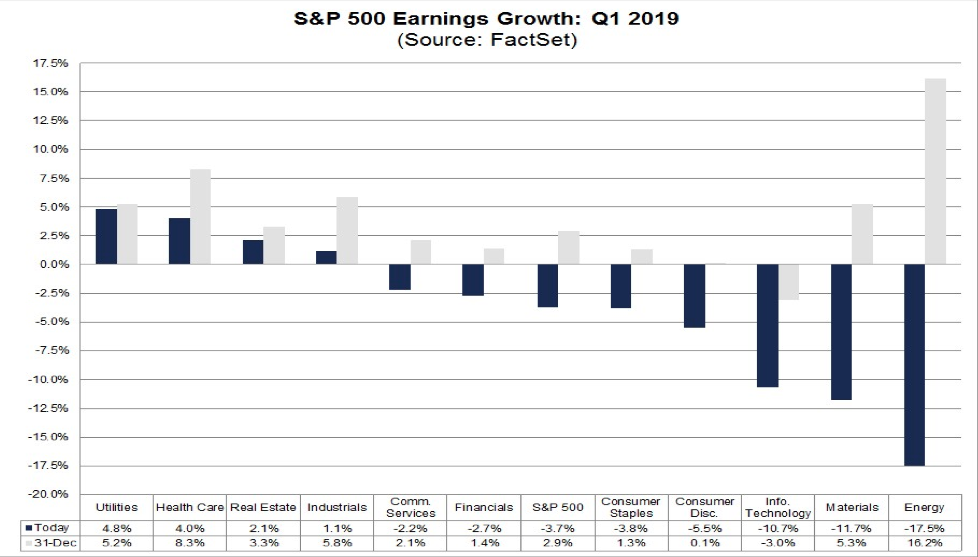
The revenue growth rate for Q1 2019 is 4.9% today compared to the estimated (year-over-year) revenue growth rate of 6.6% on December 31. Nine of the eleven sectors are projected to report year-over-year growth in revenues, led by the Communication Services and Health Care sectors. Two sectors are predicted to report a year-over-year decline in revenues: Energy and Information Technology.
- For Q2 2019, analysts are projecting earnings growth of 0.1% and revenue growth of 4.6%.
- For Q3 2019, analysts are projecting earnings growth of 1.7% and revenue growth of 4.4%.
- For Q4 2019, analysts are projecting earnings growth of 8.1% and revenue growth of 4.8%.
- For CY 2019, analysts are projecting earnings growth of 3.8% and revenue growth of 4.9%.
- The forward 12-month P/E ratio for the S&P 500 is 16.6. This P/E ratio is above the 5-year average (16.4) and above the 10-year average (14.7).
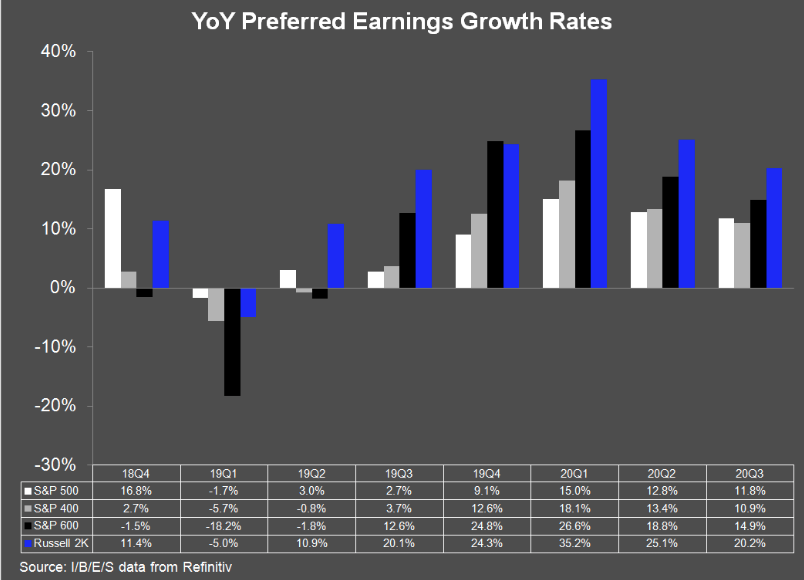
It’s important to notate that FactSet forecasts have largely proven overly conservative for many, many years. They have a the worst imaginable forecast efficacy rate of 0% because they don't include in their forecast beat rate percentage (on average). Additionally, Lipper Insights/Reuters forecast for earnings have been far more accurate. Presently and through each quarter of 2019, Lipper Insights/Reuters is forecasting higher earnings than FactSet. (See chart below)
During the upcoming week, eight S&P 500 companies are scheduled to report results for the first quarter.
In terms of fund flows for the previous trading week, fund investors were net purchasers of taxable fixed income funds (+$6.6 billion), equity funds (+$3.6 billion), and municipal bond funds (+$1.4 billion), while being net redeemers of money market funds (-$35.7 billion, their largest weekly net outflows since June 20, 2018). During the October-December rout in stocks last year, these funds gained $168 billion and then kept gaining even after stocks bottomed post-Christmas. While net outflows remain the theme for equity ETF’s in 2019, last week found some relief in some of the key equity ETFs.
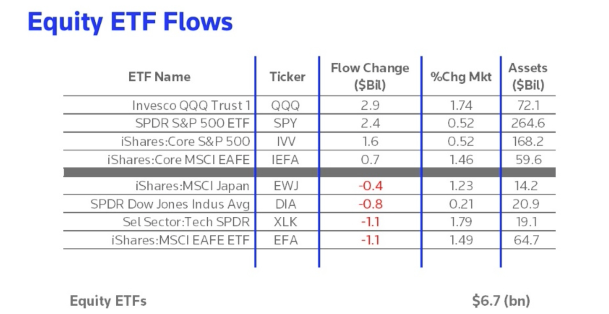
Oddly enough and in an effort to bring the buyback conversation into play once again, fund flows came back into certain equity ETFs ahead of a period where liquidity may prove lacking. This remains to be seen of course. The market seems to inflict the most amount of pain where there resides the greatest confluence of sentiment. After the market route last Friday, many investors are of the opinion the stars are aligning for a market pullback and as such, the sentiment has aligned accordingly.
Investor Takeaways
The S&P 500 finished right on the pivotal 2,800 level Friday and with a significant decline for the trading day. If you think that was by chance or by accident, I’d very much ask that you reconsider that thought. Algorithms took the market lower as liquidity and fear pervaded the market in 2018 and right back up as the worst fears were proven exaggerated in early 2019. What comes next will all depend on the geopolitical resolutions from Brexit and U.S./China trade as well as realized Q1 2019 earnings.


