
Small-Caps Catch Up…
In this week’s Dirty Dozen [CHART PACK], we talk about stubborn bears, further upside in risk assets, make the case for a small-caps catch up play, cover one sided positioning in bonds, pitch a homebuilder supply stock and a long ETHUSD trade, plus more…

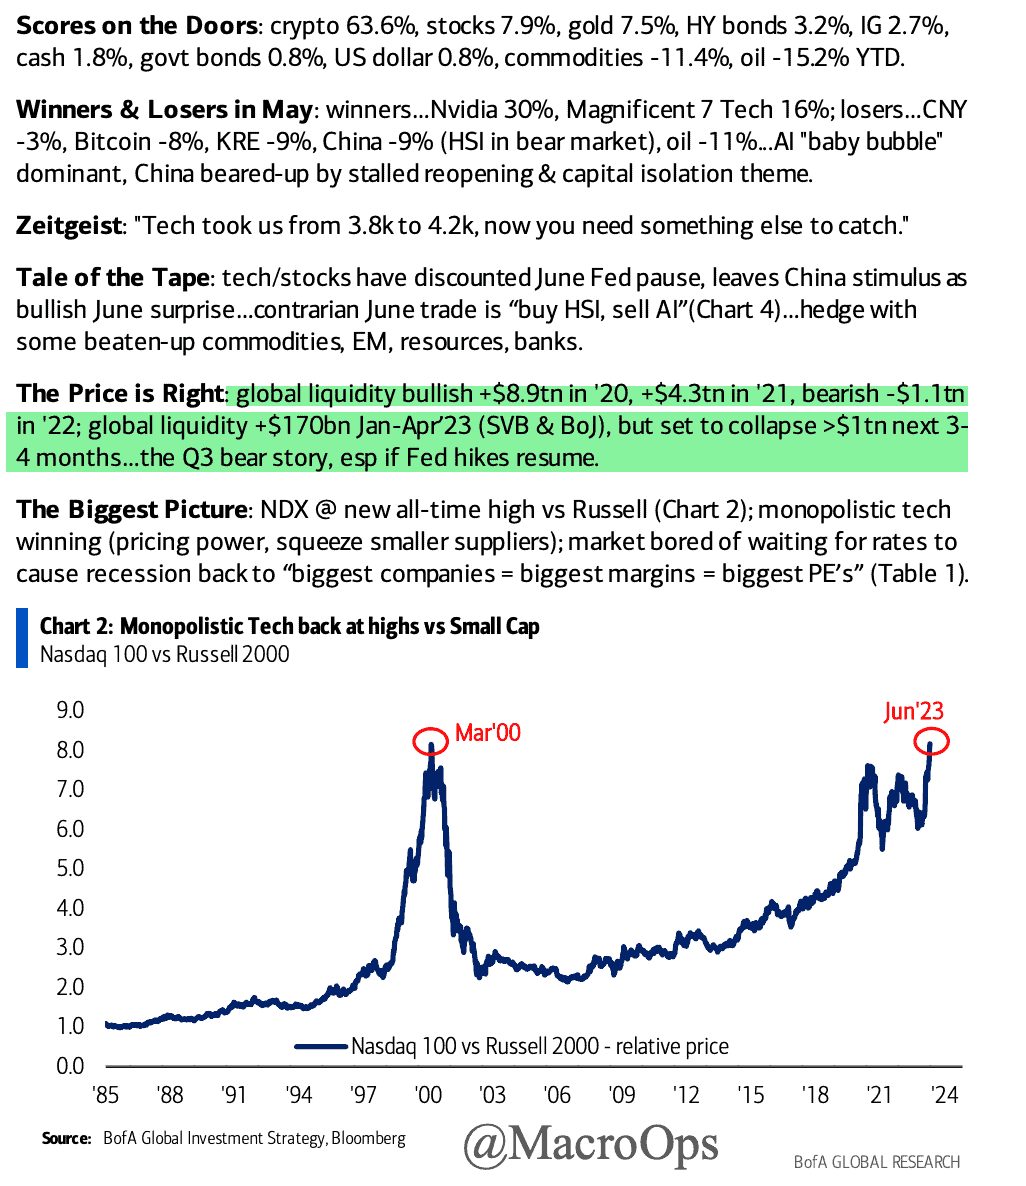
- “Global liquidity bullish… but set to collapse > $1trn next 3-4 months… the Q3 bear story, especially if Fed hikes resume” via BofA.
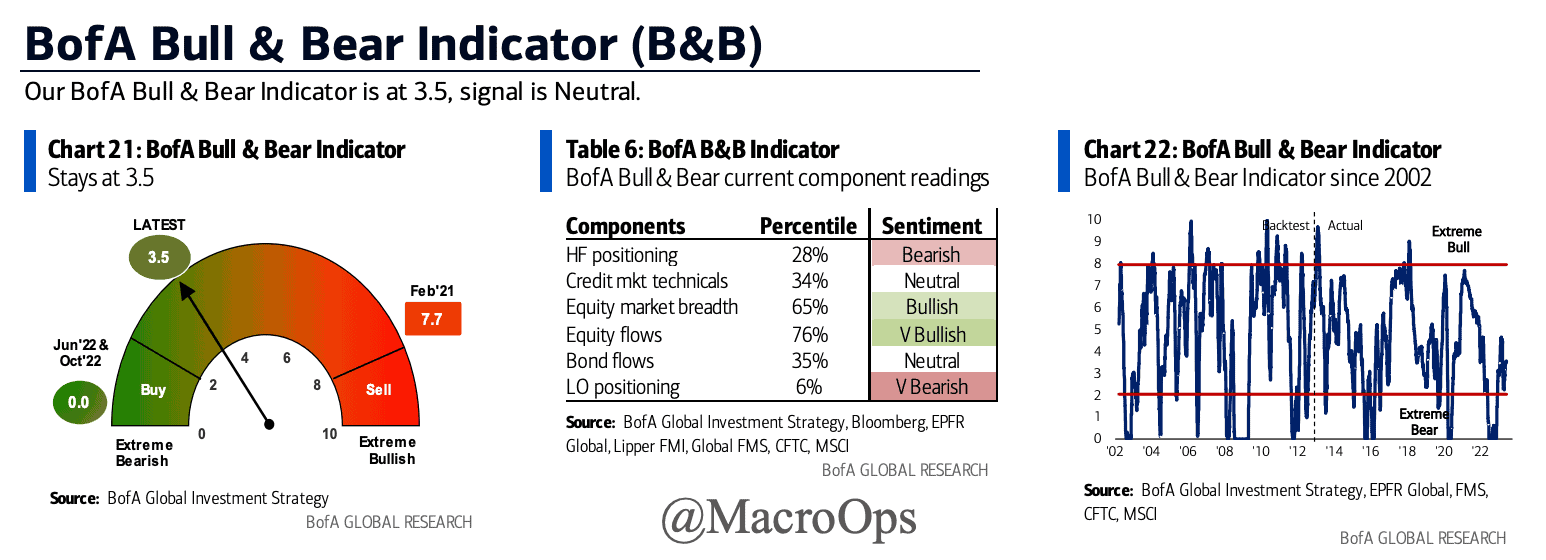
- Market sentiment remains stubbornly bearish, despite the positive technicals. This continues to be a strong tailwind for risk assets (chart via BofA).
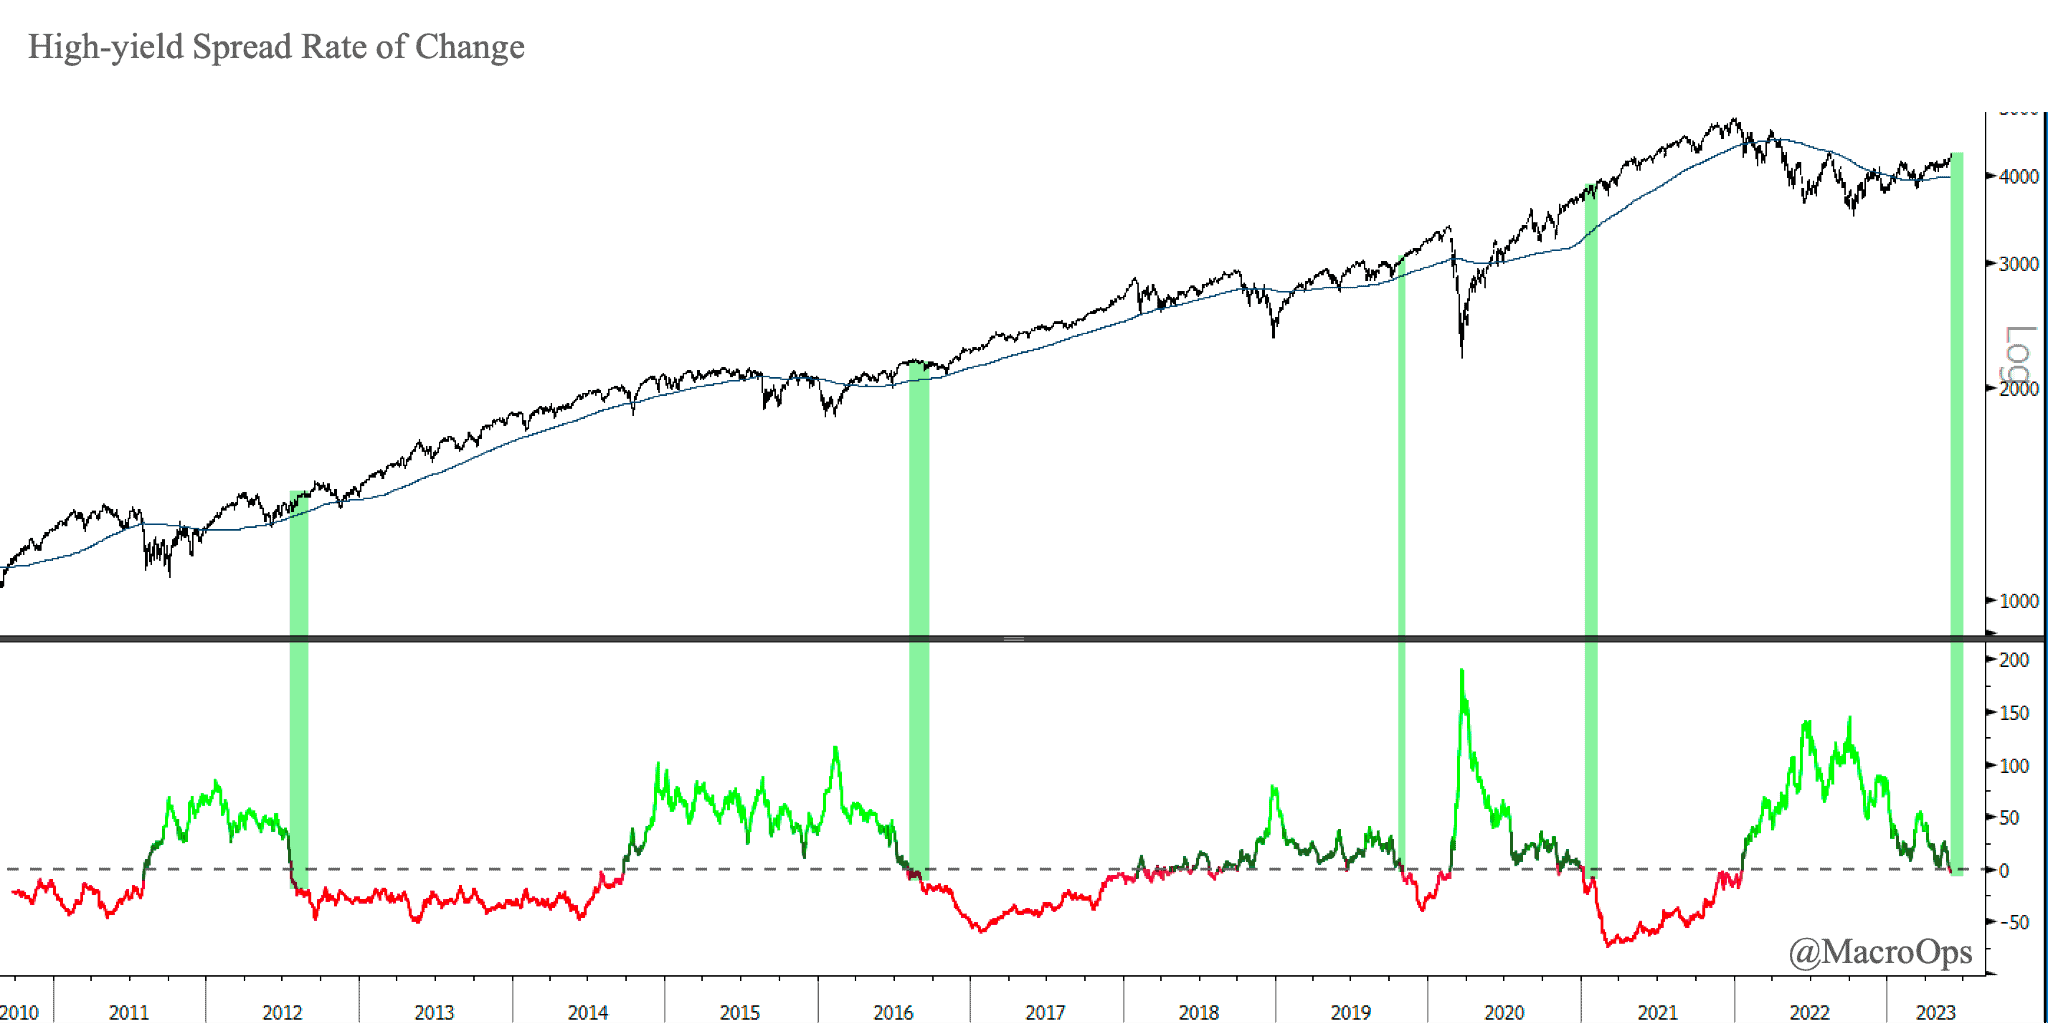
- Our high-yield spread rate of change indicator just flipped below zero for the first time since early 22, meaning spreads are tightening which is a positive. Vertical green lines mark past instances showing this typically leads to strong forward equity returns.
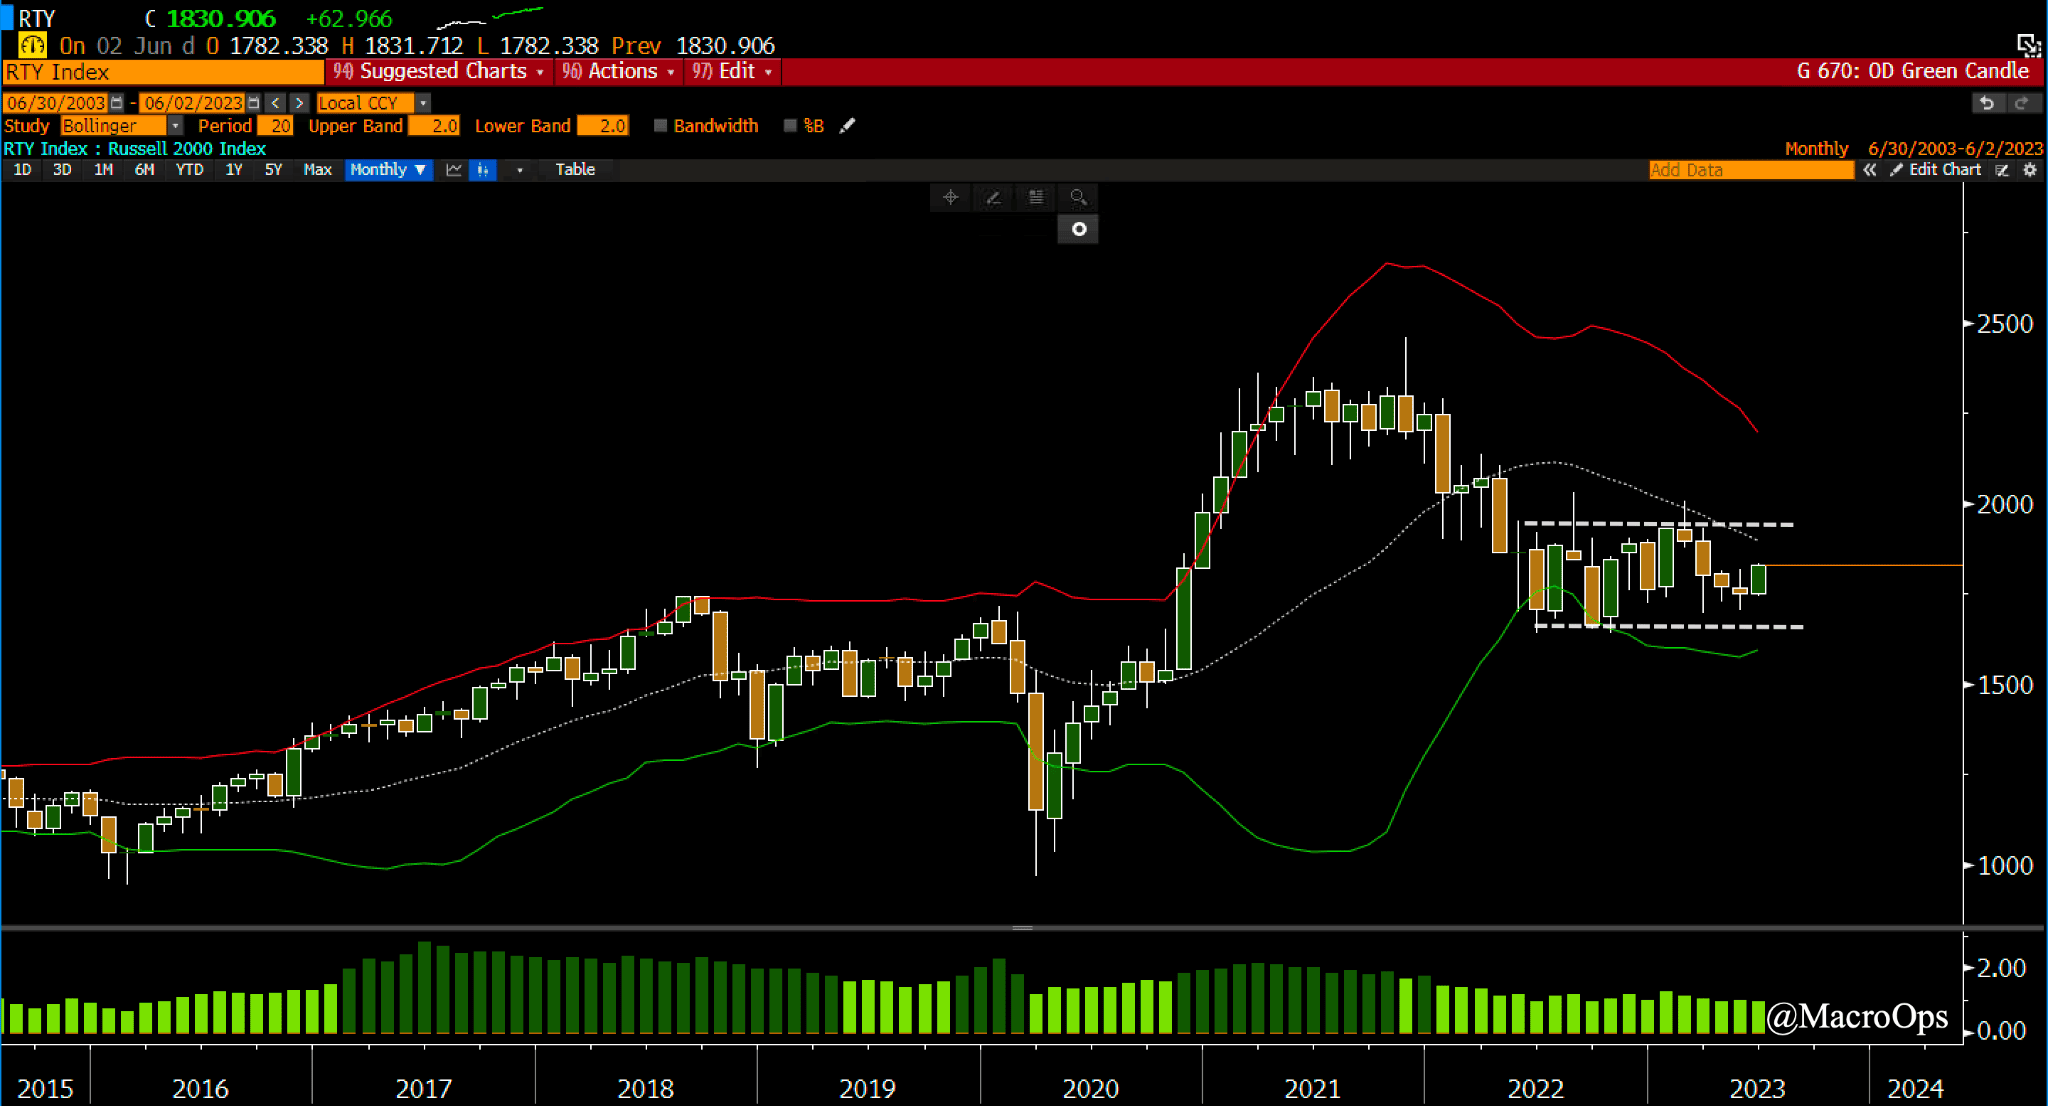
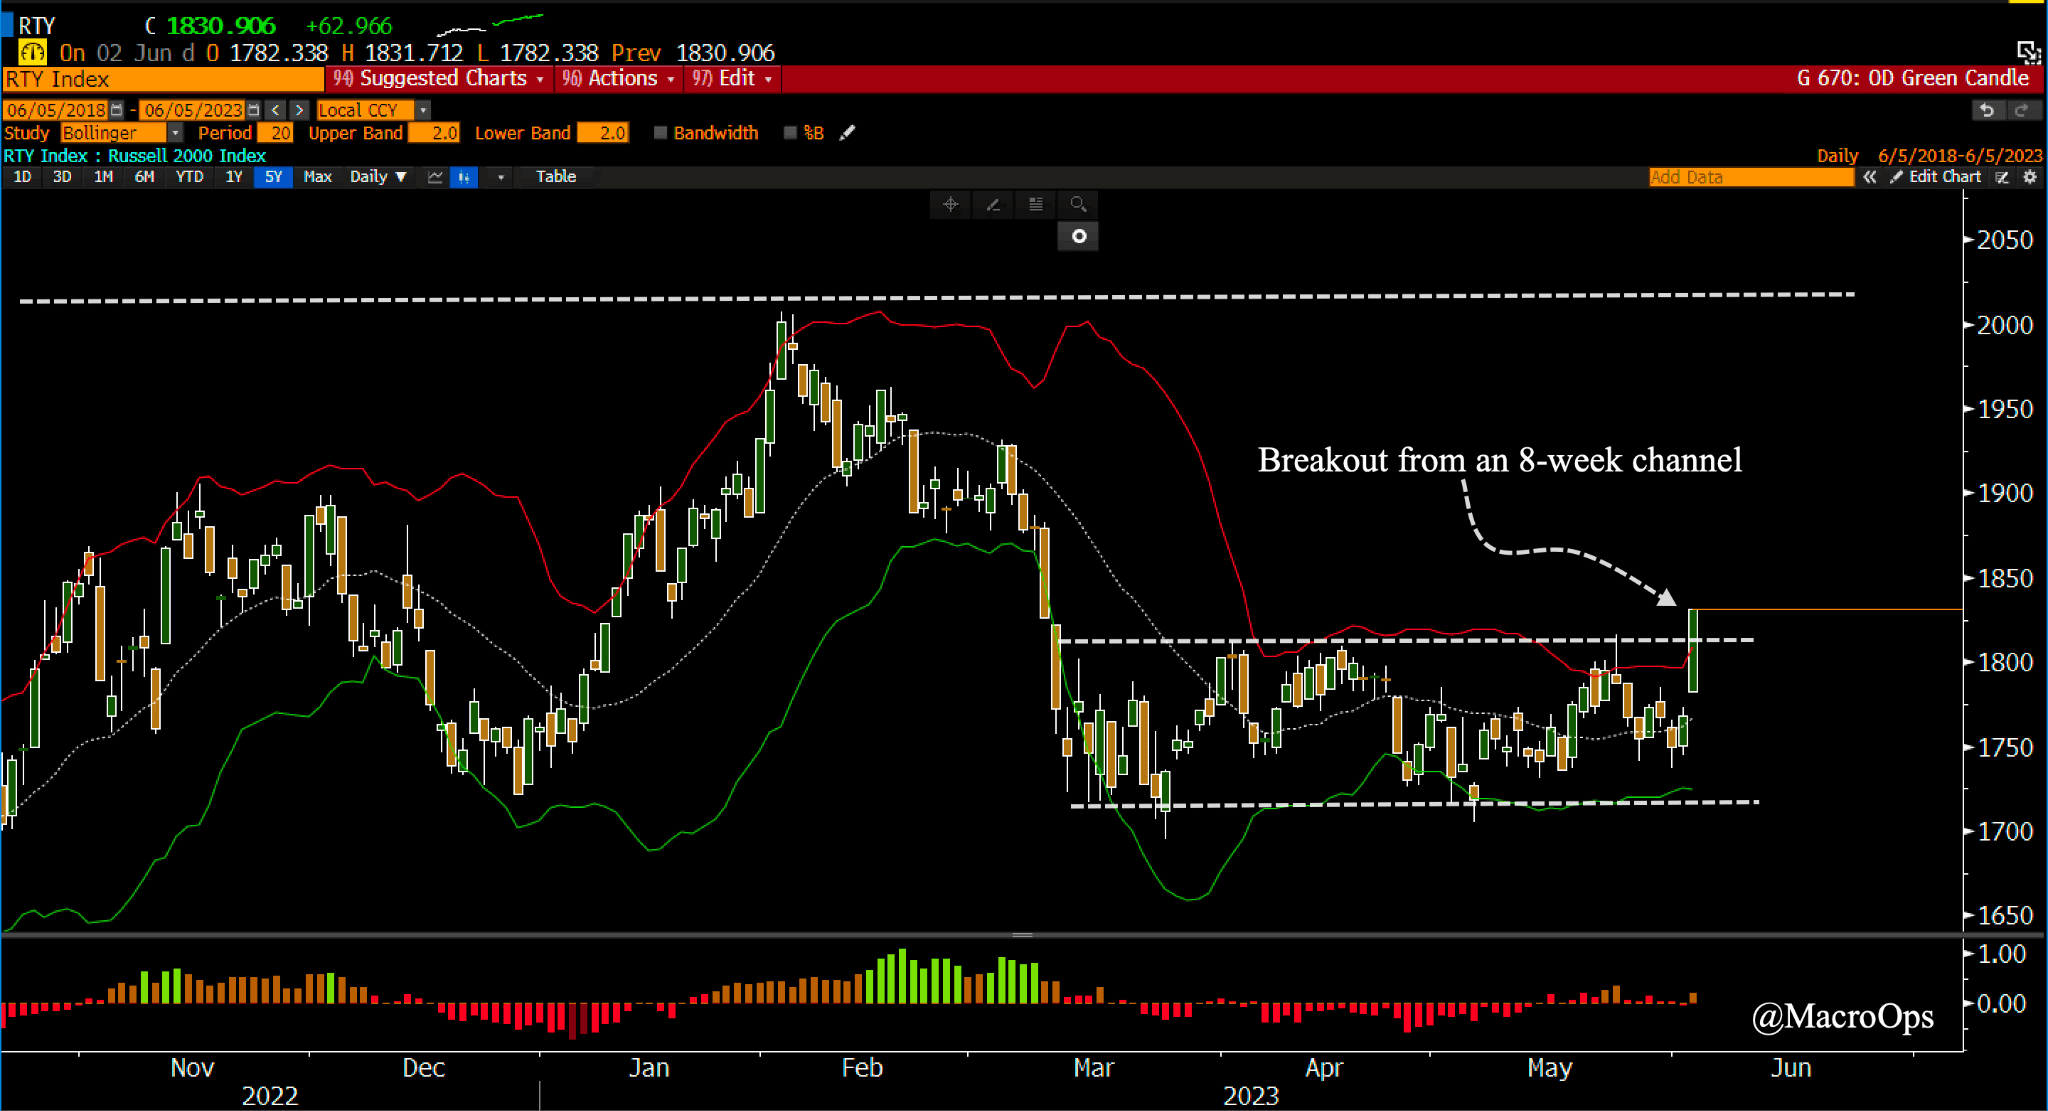
- Last week we pointed out the short-term overextension signals in the Qs, making the point that it’s a good idea to tighten up stops on tech longs. This week we’re getting long small-caps which look set to play some catch up to the rest of the market.
The below chart is a monthly showing the RTY has been trading in a 12-month rectangle (IWM).
- The daily chart shows RTY broke out Friday from a 10-week rectangle at the bottom end of its larger monthly pattern.
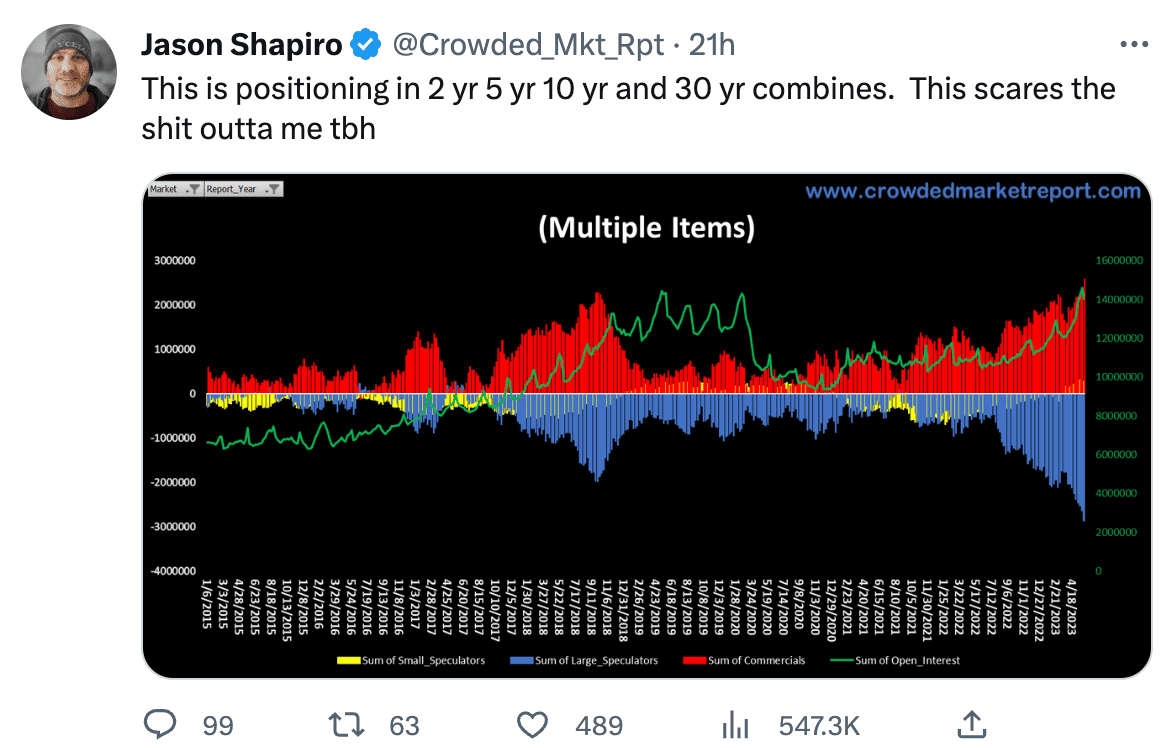
- Speculators are very short the entire curve. I don’t see a trade here yet as the technicals still favor downside but worth keeping an eye on bonds.
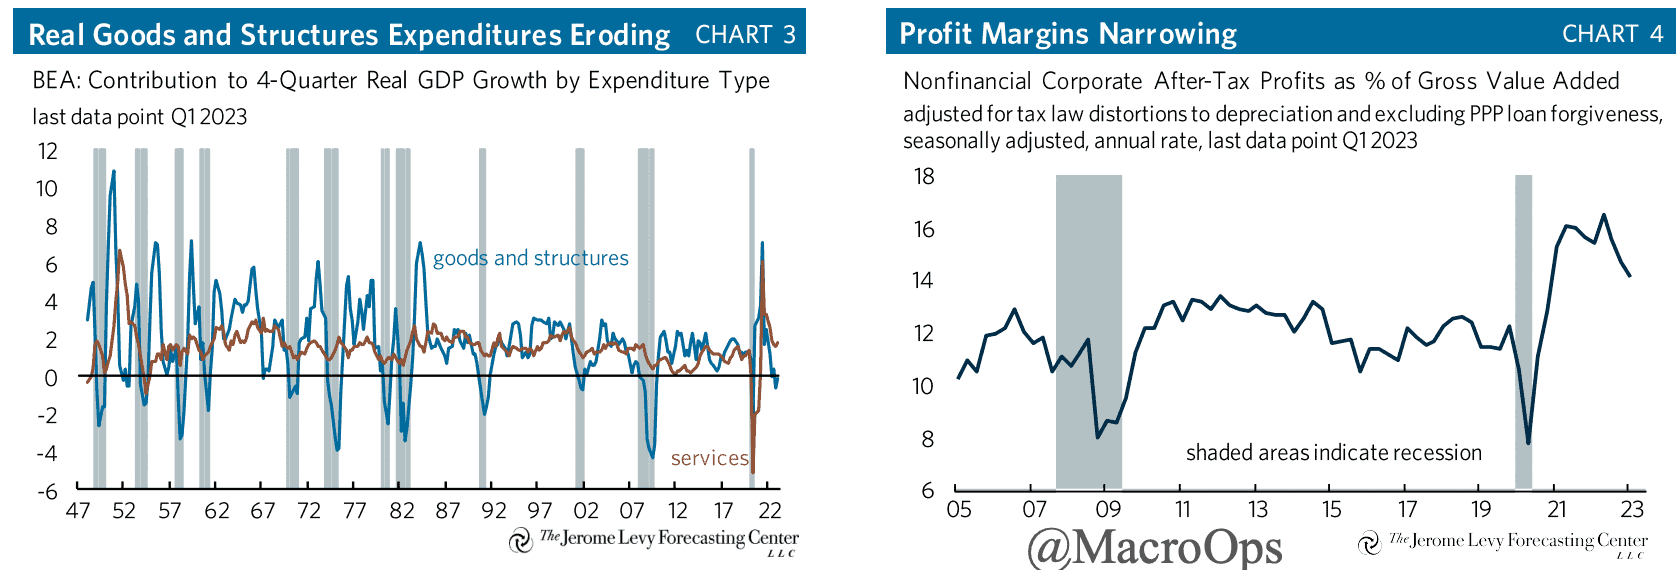
- “Aggregate corporate profits have reportedly fallen almost 14% from their peak in the second quarter of last year, and the outlook is for more to come. The economic expansion is sputtering, time is working against financial stability, and recent yield increases — and, potentially, further Fed hiking — can only aggravate the situation” via Jerome Levy Forecasting Center.
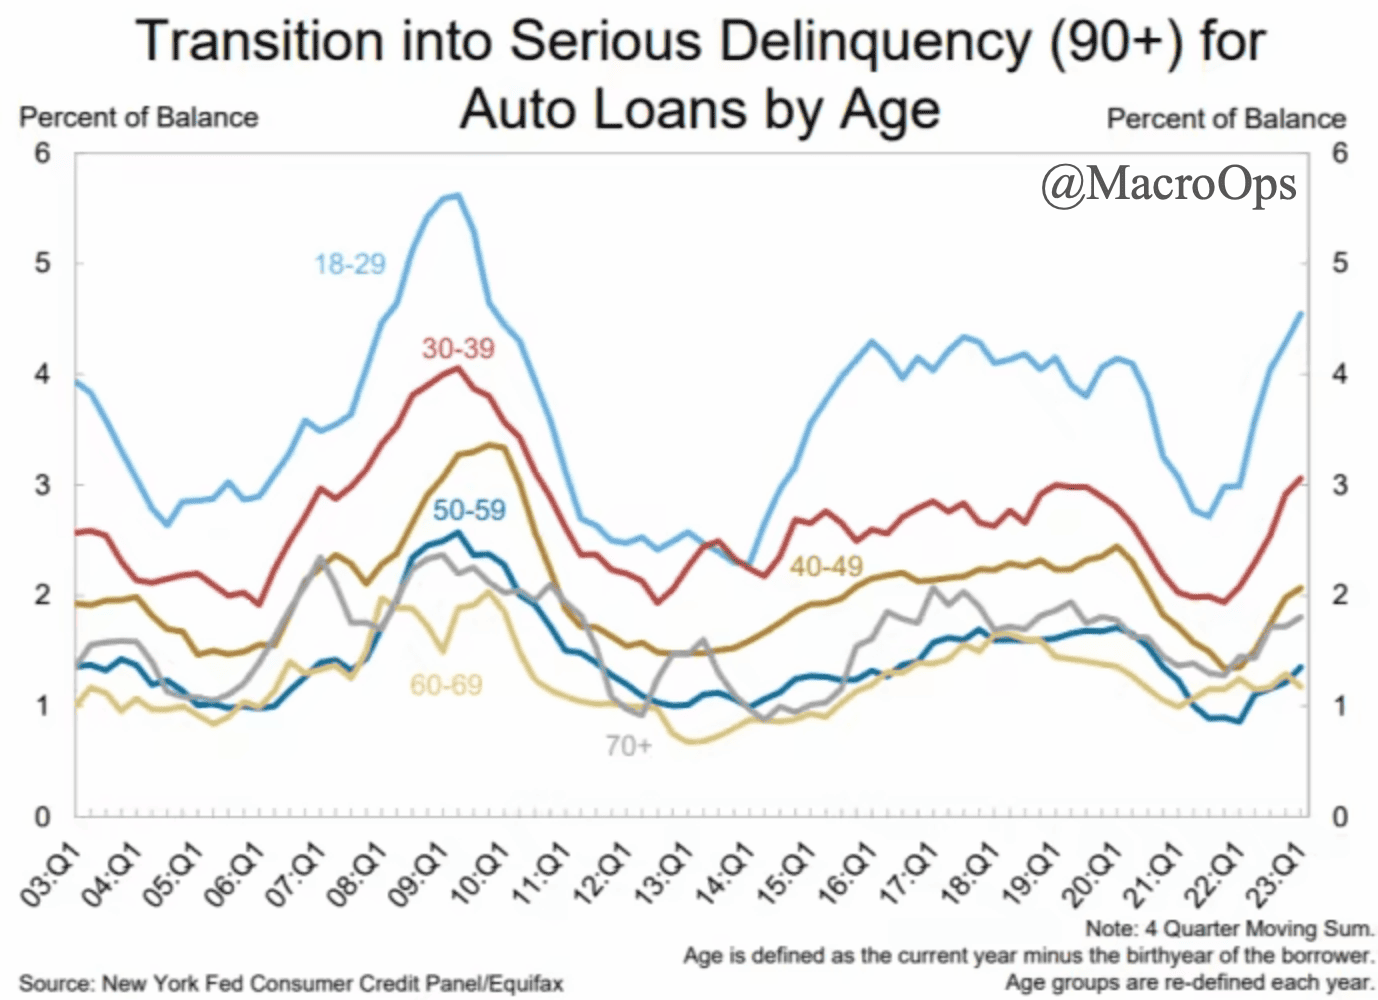
- And while financial stress remains low for the most part at the moment, there are some growing signs that this is set to change in the latter half of the year. Chart from the NY Fed’s latest Household Credit report.
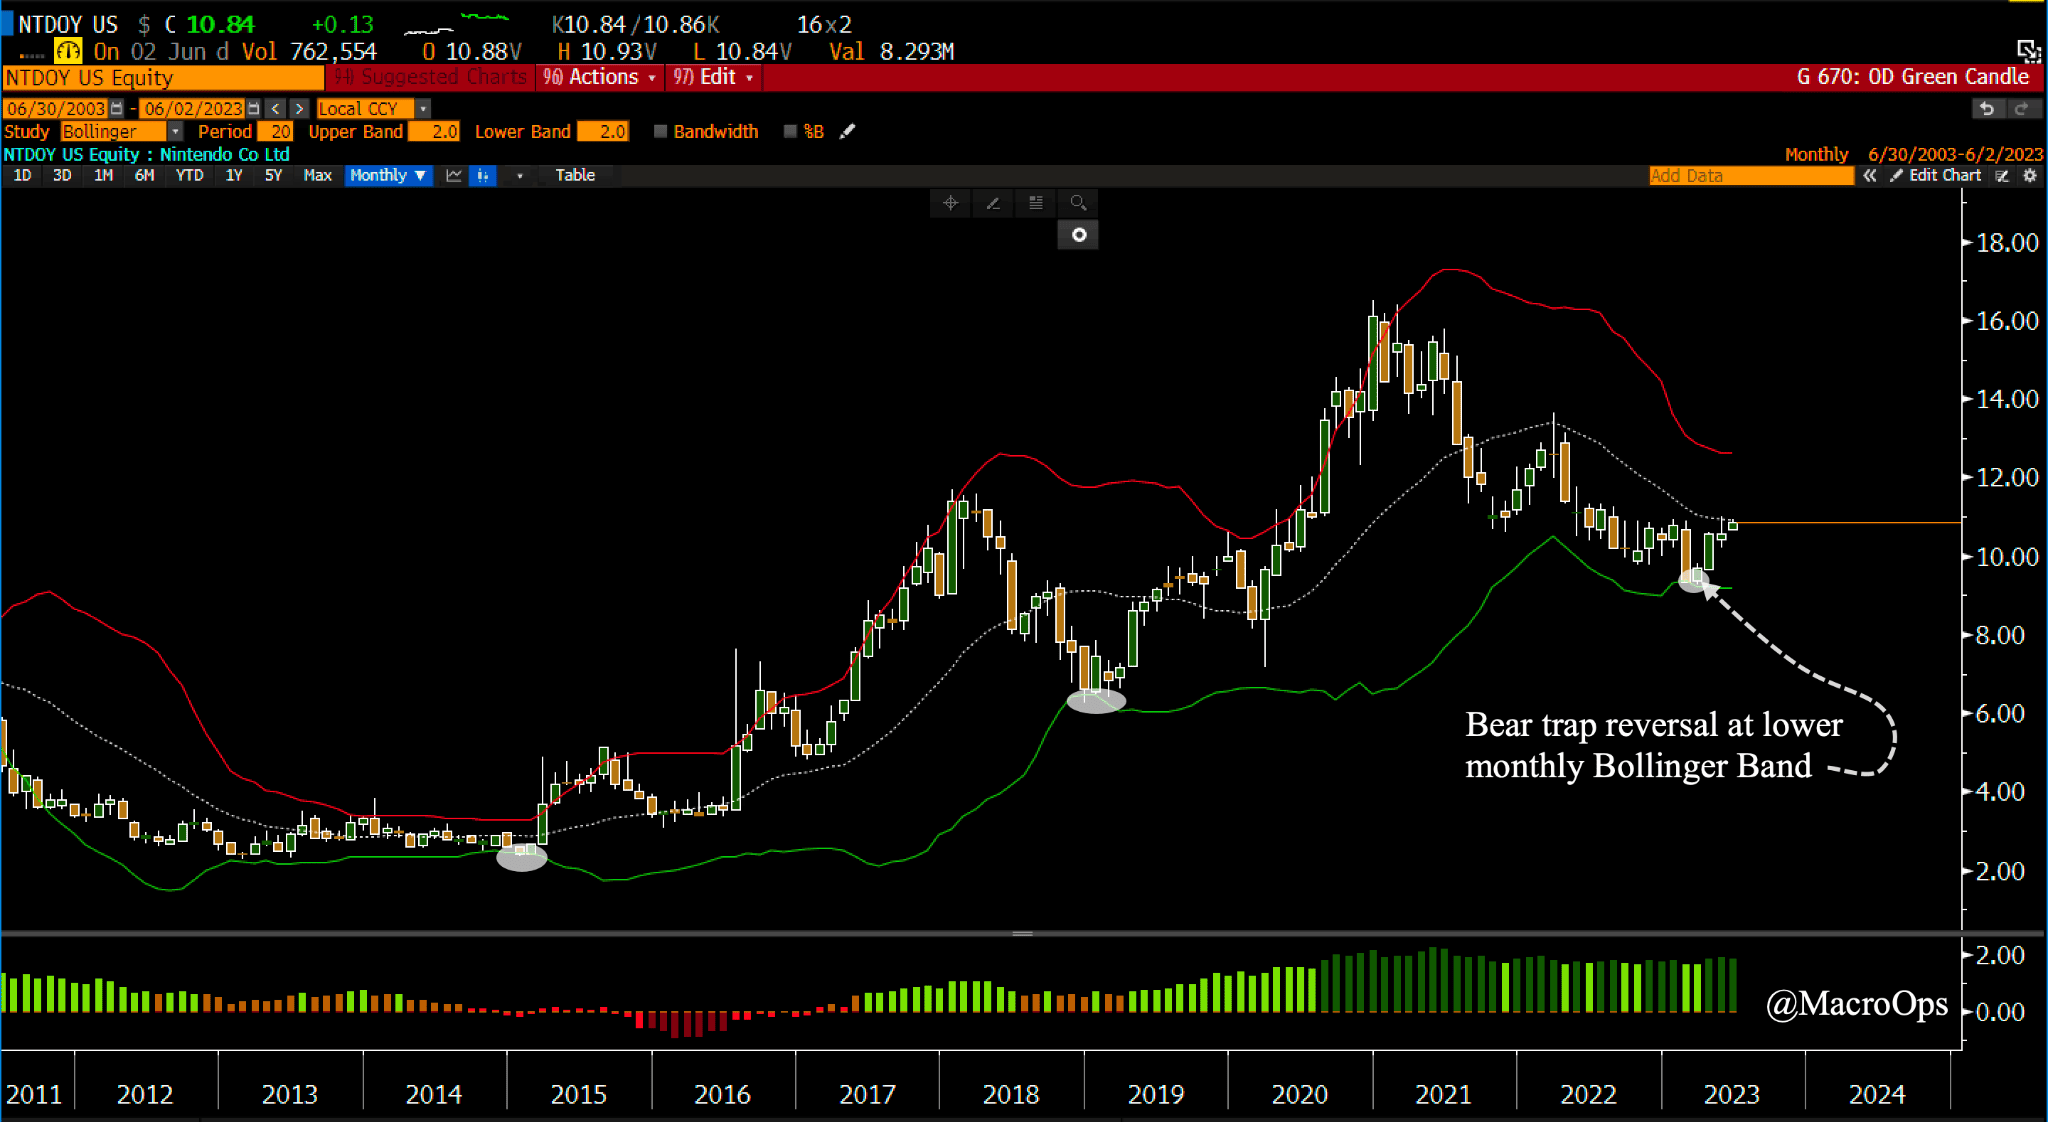
- We pointed out the bullish setup in NTDOY back in April when the stock saw a bear trap reversal at its lower monthly Bollinger Band, a level which has worked as major support in the past. The trade continues to setup nicely and looks ready to run.
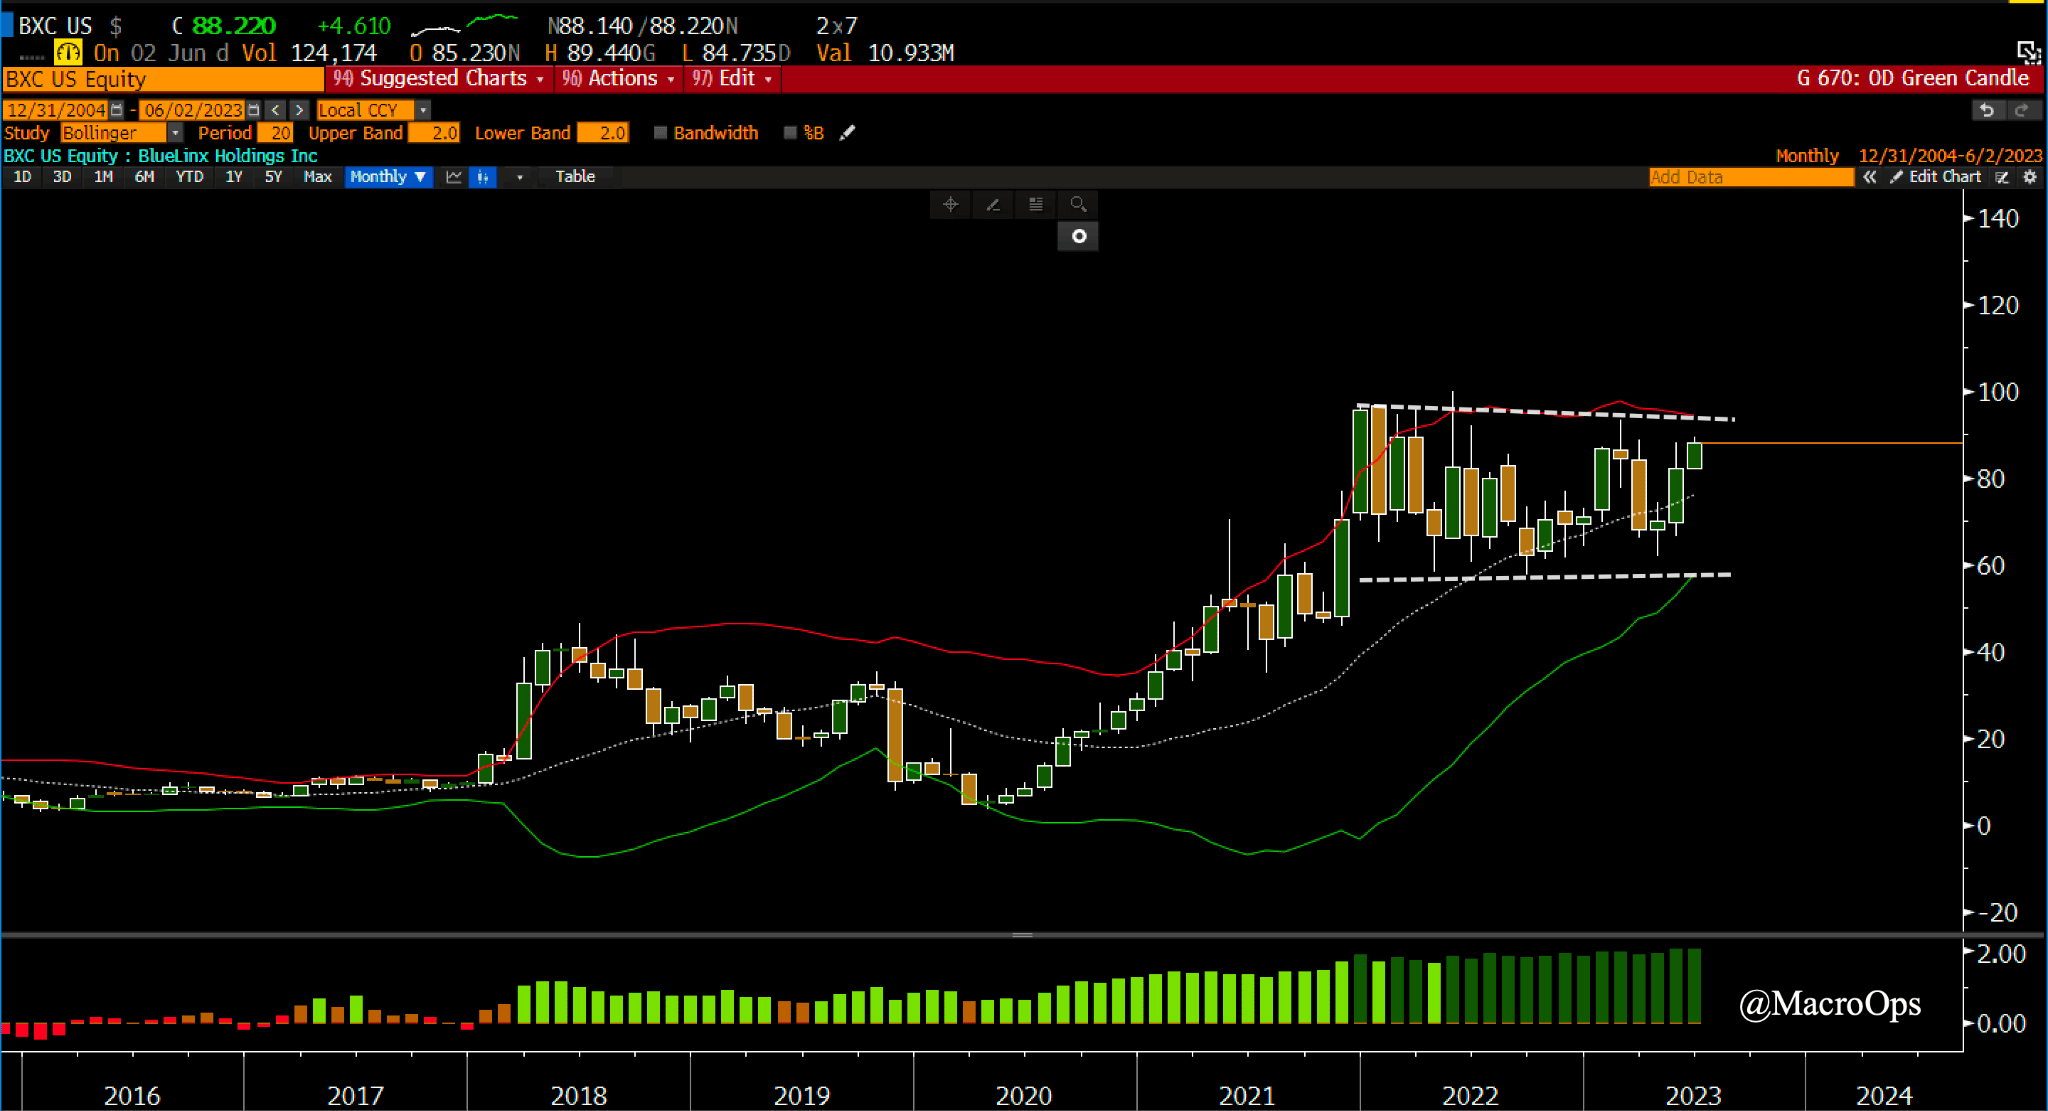
- Bluelinx Holings (BXC), a homebuilder supplies company, is coiled in a 18-month compression regime. Compression regimes tend to lead to large trends. Watch this one for a breakout soon. Chart is a monthly.
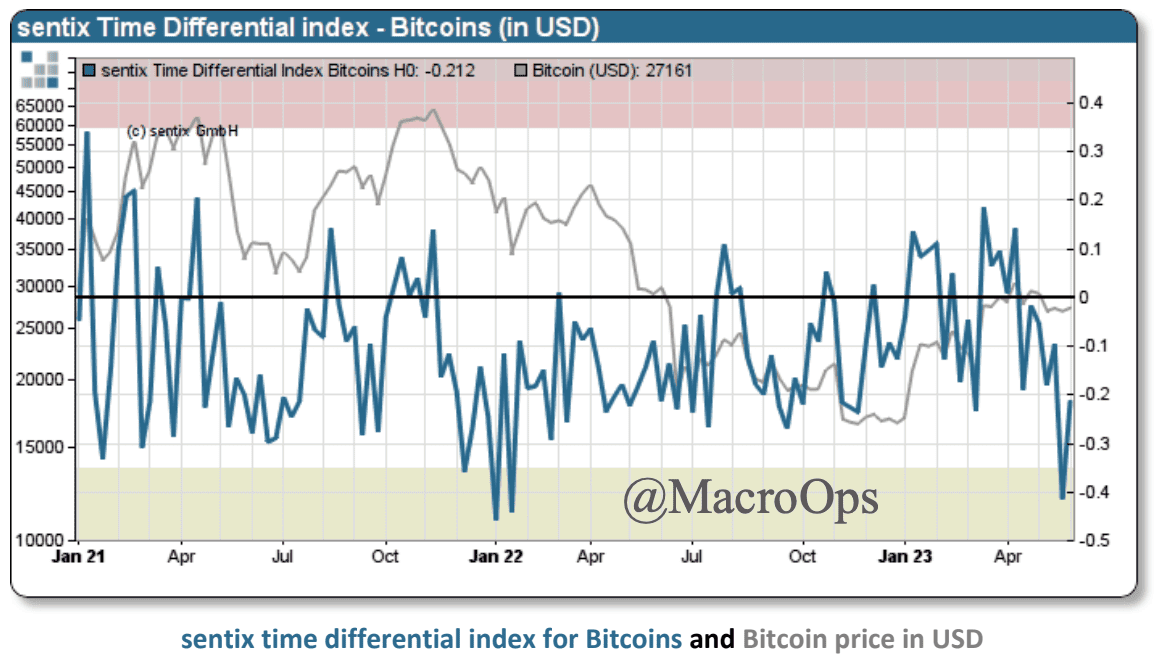
- Sentix’s TD Index (a composite measure of sentiment) triggered a buy signal recently.
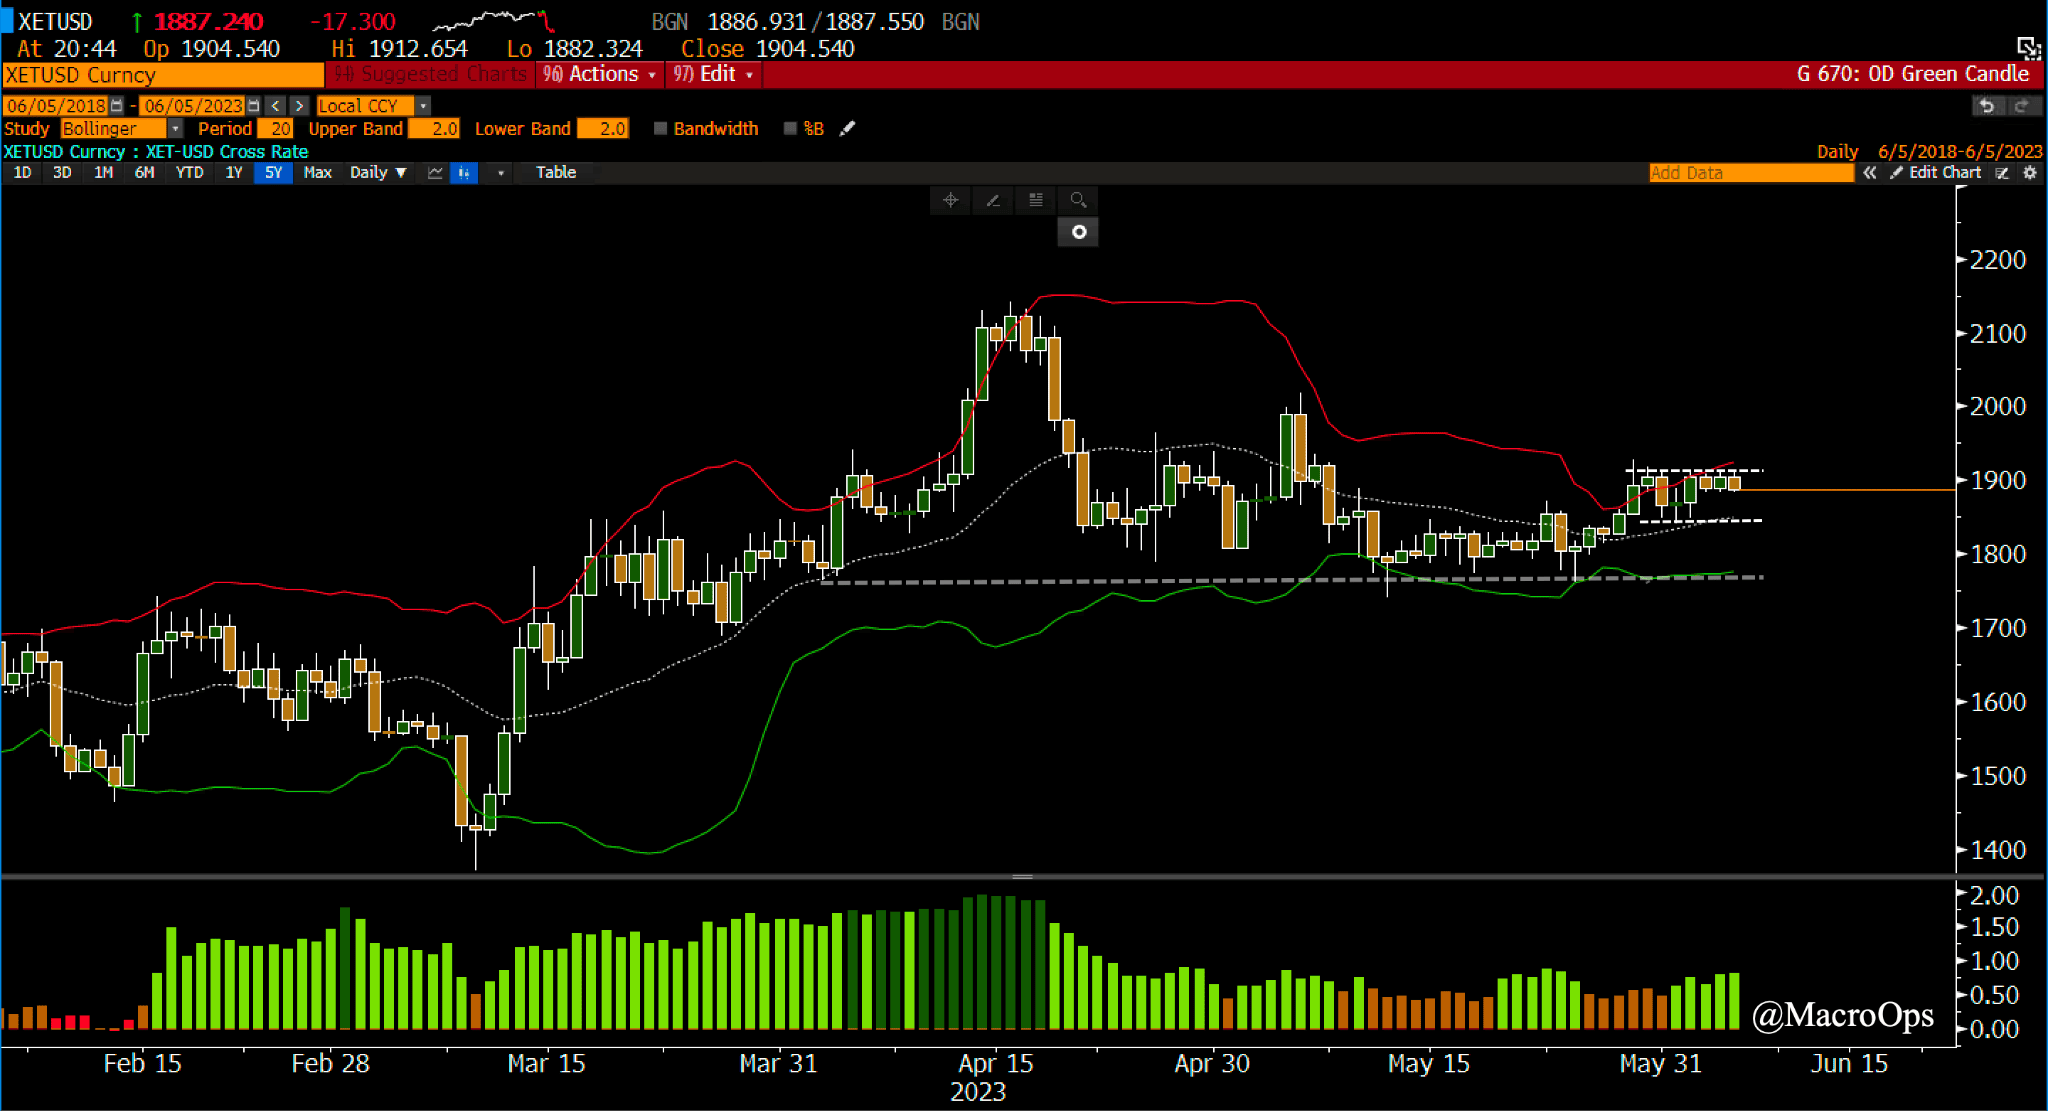
- We like the ETHUSD chart over BTC. It’s in a Bull Quiet regime and is coiling in a tight pennant. You can put a buy stop right above this range and let the market pull you in.
Thanks for reading.
More By This Author:
A Budding Cotton TradeA Nuclear Resurgence
Water Off A SPX’s Back…
Disclaimer: All statements are solely opinions and are for educational purposes only.
How did you like this article? Let us know so we can better customize your reading experience.

Comments
Leave a comment to automatically be entered into
our contest to win a free Echo Show.

