
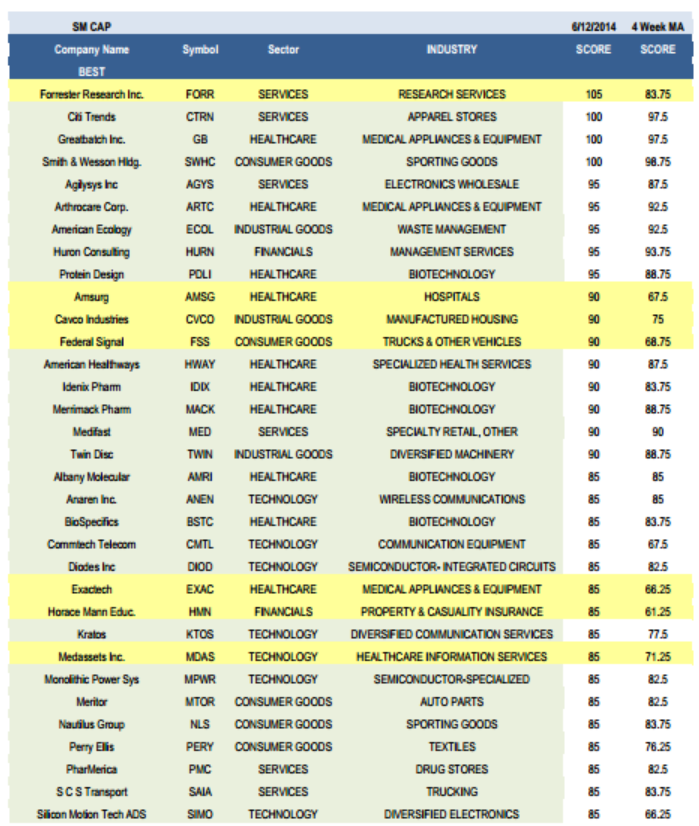
Small Cap Best & Worst Report - June 12, 2014
The highest scoring names in small cap from 1 year ago (6/13/2013) returned 440 bps more than the Russell 2000. The best performers have been CRZO up 130%, QCOR up 99%, NTRI up 79%, FSS up 70%, UHAL up 70%, MPWR up 70%, and CGNX up 67%.
|
Score |
Russell |
Excess |
|
>90 |
2000 |
|
|
24.49% |
20.09% |
4.40% |
- Utilities are the top scoring small cap sector.
- Trucking is the top small cap industry.
The average small cap score is 50.11 this week, above the four week moving average score of 46.80. The average small cap stock is trading -23.8% below its 52 week high, -0.52% below its 200 dma, and has 8.37 days to cover held short (down from 8.9 days at the end of May).
The top scoring small cap sector is utilities, followed by industrial goods and consumer goods. Services and financials score in line with the average universe score. Healthcare, technology and basic materials score below average (trade up in market cap where possible in these baskets).
|
SMALL CAP |
|
|
|
|
|
|
|
# Stocks |
Average |
Median |
% 75 and above |
% 25 and below |
|
UTILITIES |
4 |
60.0 |
55 |
25.00% |
0.00% |
|
INDUSTRIAL GOODS |
32 |
55.2 |
50 |
18.75% |
0.00% |
|
CONSUMER GOODS |
38 |
53.2 |
50 |
23.68% |
7.89% |
|
SERVICES |
94 |
50.9 |
45 |
15.96% |
8.51% |
|
FINANCIALS |
38 |
50.0 |
47.5 |
10.53% |
10.53% |
|
HEALTHCARE |
176 |
49.1 |
45 |
10.80% |
15.34% |
|
TECHNOLOGY |
108 |
48.9 |
45 |
12.96% |
13.89% |
|
BASIC MATERIALS |
38 |
48.4 |
45 |
13.16% |
15.79% |

The number of stocks across our entire all-cap universe that are trading more than 5% above their 200 dma (the top of our EBCM band) continues to climb, reaching 670 this week.
The following chart shows historical small cap scores since 2010.
|
SMALL CAP |
6/12/2014 |
|
INDUSTRY |
SCORE |
|
BEST |
|
|
TRUCKING |
78.33 |
|
PROPERTY & CASUALITY INSURANCE |
71.00 |
|
AUTO PARTS |
70.00 |
|
RESTAURANTS |
70.00 |
|
RAILROADS |
66.67 |
|
WORST |
|
|
CREDIT SERVICES |
36.25 |
|
GOLD |
34.00 |
|
BROADCASTING |
33.00 |
|
COMPUTER PERIPHERALS |
31.67 |
Trucking (SAIA, MRTN) is the best small cap industry. The industry benefits from rising tonnage and tight driver capacity driven pricing power. The DOT freight index is neared an all-time high in April and the potential for a suspension to hours of service restarts may benefit operators (if enacted). April's freight shipments were up 4.8% year-over-year. P&C insurer (HMN, STFC, MIG) rates rose 3% in May, according to MarketScout, and related insurers are typically strong performers through storm season. Auto parts (MTOR, SMP, SRI) sales demand is likely to head higher thanks to rebounding activity in Europe. Through the first four months of this year, personal and commercial vehicle registrations are 7.4% and 8.7% higher than last year, respectively. According to the Nat'l Restaurant Association's Restaurant Performance Index, restaurant operators (RRGB, DAVE, BJRI) are benefiting from improving foot-traffic and same store sales. The index rose for a second consecutive month in April, reaching its best levels since last May. Railroad (GBX) activity continues to support related companies. Intermodal rail carloads have now shown year-over-year improvement in 54 consecutive months, rising 8% in May. Total U.S. traffic (including intermodal) is 4.3% higher year-to-date than 2013.
In small cap basics, only independent oil & gas (GDP, PVA, PQ, CRK) score above average. In consumer, buy auto parts and processed & packaged goods (BDBD). P&C insurers and regional banks (MBWM, SNBC) score above average in financials. Only medical instruments (LMNX, HTWR, ATRI) score above average in healthcare. The best industrial basket is general building materials (USLM). In services, concentrate on truckers, restaurants, and rails. The best technology groups are semi ICs (DIOD, RFMD, OVTI), diversified electronics (SIMO, MEI), and semi equipment (ATMI, KLIC). Managers should remember; however, that the SEMI book-to-bill typically peaks in the second quarter.
|
SMALL CAP INDUSTRY SCORE |
|
6/12/2014 |
|
Sector |
INDUSTRY |
Score |
|
|
|
|
|
BASIC MATERIALS |
INDEPENDENT OIL & GAS |
56.67 |
|
BASIC MATERIALS |
STEEL & IRON |
48.57 |
|
BASIC MATERIALS |
OIL & GAS DRILLING & EXPLORATION |
46.67 |
|
BASIC MATERIALS |
INDUSTRIAL METALS & MINERALS |
43.00 |
|
BASIC MATERIALS |
GOLD |
34.00 |
|
CONSUMER GOODS |
AUTO PARTS |
70.00 |
|
CONSUMER GOODS |
PROCESSED & PACKAGED GOODS |
51.25 |
|
CONSUMER GOODS |
TEXTILES |
45.00 |
|
CONSUMER GOODS |
HOME FURNISHING & FIXTURES |
38.33 |
|
FINANCIALS |
PROPERTY & CASUALITY INSURANCE |
71.00 |
|
FINANCIALS |
REGIONAL BANKS |
51.43 |
|
FINANCIALS |
INVESTMENT BROKERAGE |
46.25 |
|
FINANCIALS |
SAVINGS & LOANS |
45.56 |
|
FINANCIALS |
CREDIT SERVICES |
36.25 |
|
HEALTHCARE |
MEDICAL INSTRUMENTS & SUPPLIES |
51.67 |
|
HEALTHCARE |
HOME HEALTH CARE |
50.71 |
|
HEALTHCARE |
SPECIALIZED HEALTH SERVICES |
50.00 |
|
HEALTHCARE |
MEDICAL APPLIANCES & EQUIPMENT |
49.17 |
|
HEALTHCARE |
BIOTECHNOLOGY |
47.14 |
|
HEALTHCARE |
DRUG MANUFACTURERS |
42.33 |
|
HEALTHCARE |
DRUG RELATED PRODUCTS |
40.00 |
|
INDUSTRIAL GOODS |
GENERAL BUILDING MATERIALS |
56.67 |
|
INDUSTRIAL GOODS |
AEROSPACE/DEFENSE PRODUCTS & SERVICES |
51.00 |
|
INDUSTRIAL GOODS |
INDUSTRIAL ELECTRICAL EQUIPMENT |
48.33 |
|
INDUSTRIAL GOODS |
HEAVY CONSTRUCTION |
46.25 |
|
SERVICES |
TRUCKING |
78.33 |
|
SERVICES |
RESTAURANTS |
70.00 |
|
SERVICES |
RAILROADS |
66.67 |
|
SERVICES |
CATALOG & MAIL ORDER HOUSES |
58.33 |
|
SERVICES |
MANAGEMENT SERVICES |
57.50 |
|
SERVICES |
SPECIALTY RETAIL, OTHER |
56.67 |
|
SERVICES |
MARKETING SERVICES |
53.33 |
|
SERVICES |
BUSINESS SERVICES |
50.00 |
|
SERVICES |
STAFFING & OUTSOURCING SERVICES |
46.00 |
|
SERVICES |
EDUCATION & TRAINING SERV |
45.83 |
|
SERVICES |
APPAREL STORES |
42.08 |
|
SERVICES |
RESORTS AND CASINOS |
40.00 |
|
SERVICES |
BROADCASTING |
33.00 |
|
TECHNOLOGY |
SEMICONDUCTOR- INTEGRATED CIRCUITS |
62.14 |
|
TECHNOLOGY |
DIVERSIFIED ELECTRONICS |
60.00 |
|
TECHNOLOGY |
SEMICONDUCTOR EQUIPMENT & MATERIALS |
57.50 |
|
TECHNOLOGY |
BUSINESS SOFTWARE & SERVICES |
50.00 |
|
TECHNOLOGY |
PRINTED CIRCUIT BOARDS |
48.75 |
|
TECHNOLOGY |
SEMICONDUCTOR-SPECIALIZED |
48.33 |
|
TECHNOLOGY |
INFORMATION TECHNOLOGY SERVICES |
45.83 |
|
TECHNOLOGY |
COMMUNICATION EQUIPMENT |
45.63 |
|
TECHNOLOGY |
INTERNET INFORMATION PROVIDER |
45.00 |
|
TECHNOLOGY |
INTERNET SERVICE PROVIDERS |
45.00 |
|
TECHNOLOGY |
NETWORKING & COMMUNICATION DEVICES |
45.00 |
|
TECHNOLOGY |
SCIENTIFIC & TECHNICAL INSTRUMENTS |
44.50 |
|
TECHNOLOGY |
WIRELESS COMMUNICATIONS |
41.25 |
|
TECHNOLOGY |
INTERNET SOFTWARE & SERVICES |
38.33 |
|
TECHNOLOGY |
APPLICATION SOFTWARE |
37.00 |
|
TECHNOLOGY |
COMPUTER PERIPHERALS |
31.67 |
None.


