Silver Pullback May See Buyers And Resume Higher

Image Source: Pixabay
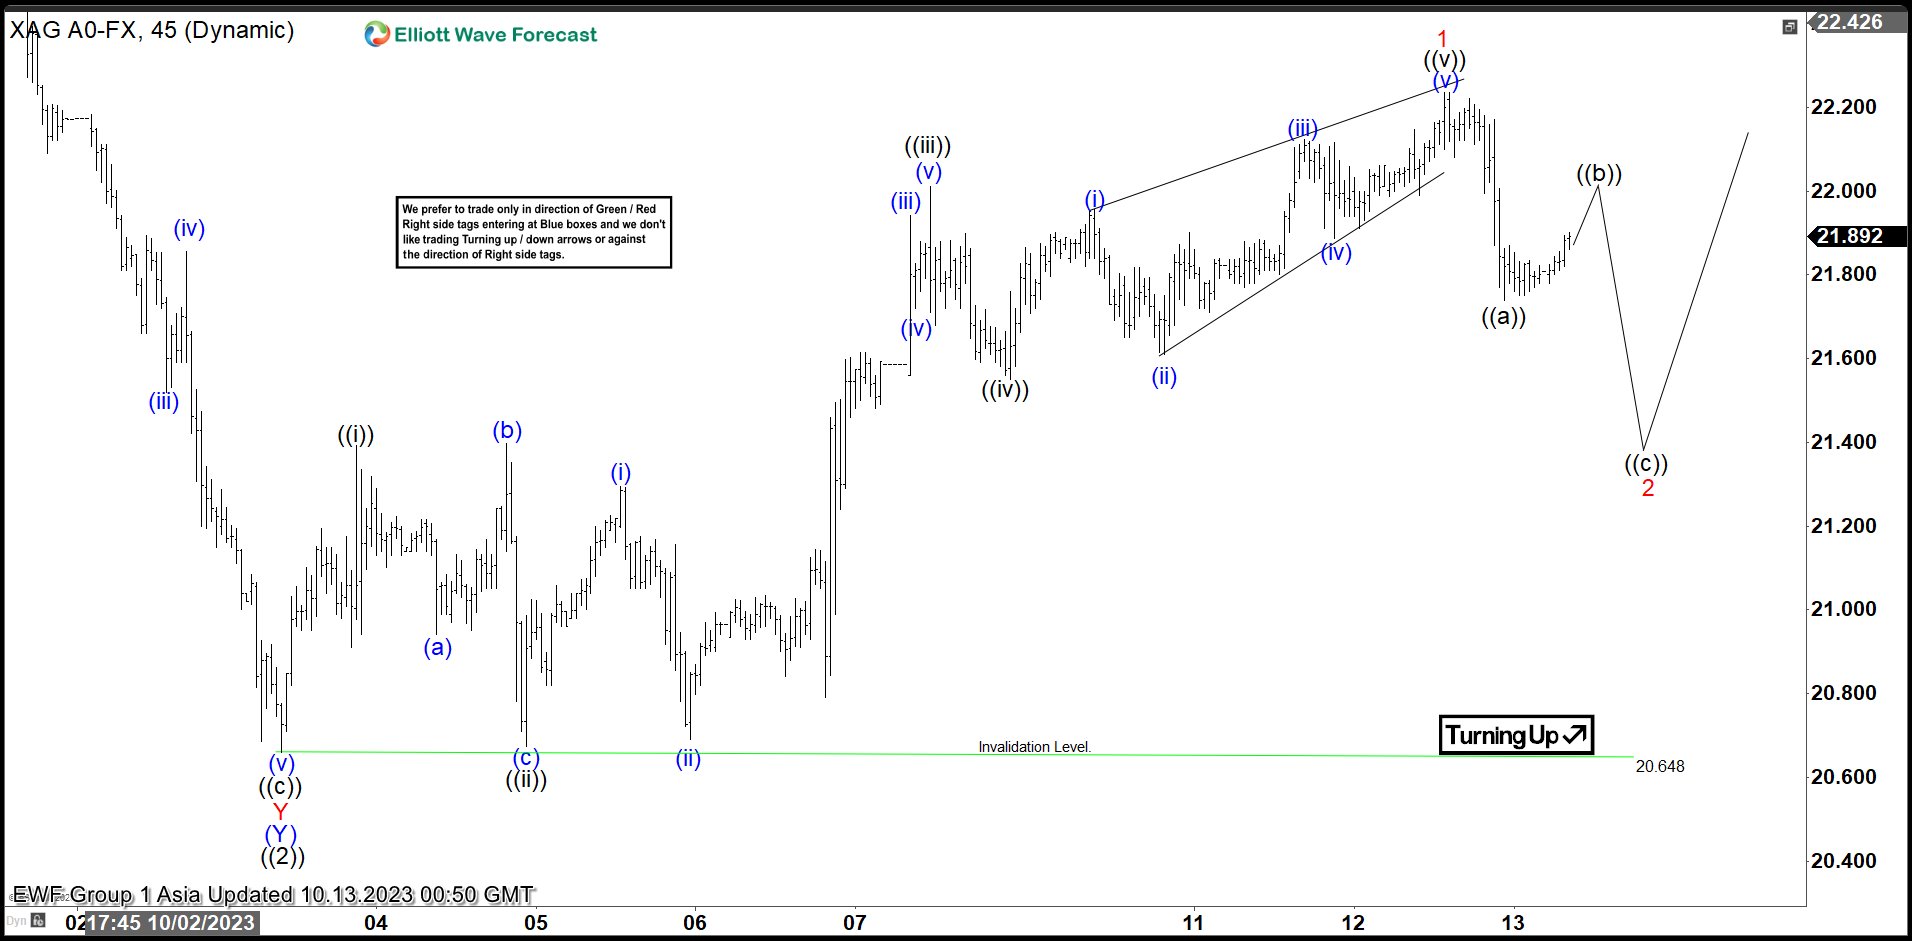
Short Term Elliott Wave in Silver (XAGUSD) suggests cycle from 5.5.2023 high ended with wave ((2)) at 20.65. Internal subdivision of wave ((2)) unfolded in a double three Elliott Wave structure. Down from 5.5.2023 high, wave (W) ended at 22.1, and wave (X) ended at 25.26. Wave (Y) ended at 20.65 which completed wave ((2)) as the 45-minute chart below shows. The metal has turned higher in wave ((3)).
Up from wave ((2)), wave ((i)) ended at 21.39 and pullback in wave ((ii)) ended at 20.67. The metal resumes higher in wave ((iii)) towards 22 and dips in wave ((iv)) ended at 21.55. The final leg higher wave ((v)) ended as a diagonal at 22.23. This completed wave 1 in higher degree. Wave 2 pullback is now in progress to correct cycle from 10.3.2023 low before the metal resumes higher. The internal subdivision of wave 2 is unfolding as a zigzag structure. Down from wave 1, wave ((a)) ended at 21.74. Expect wave ((b)) to fail below 22.23 and the metal to turn lower in wave ((c)) before ending wave 2 correction. Near term, as far as the pivot at 20.64 low stays intact, expect pullback to find support in 3, 7, or 11 swing for further upside.
Silver 45 Minutes Elliott Wave Chart
(Click on image to enlarge)
Silver (XAGUSD) Elliott Wave Video
Video Length: 00:05:20
More By This Author:
S&P 500 Futures Impulsive Rally Favors The Bullish Side10 Best Defensive Stocks To Invest In 2023
Tesla 5 Swing Sequence Favors Upside
Disclaimer: Futures, options, and over the counter foreign exchange products may involve substantial risk and may not be suitable for all investors. Leverage can work against you as well as for ...
more


