

Image Source: Pixabay
- Silver advances 0.63% to $23.12, reacting to US employment strength and factory orders, countered by slowing business activity.
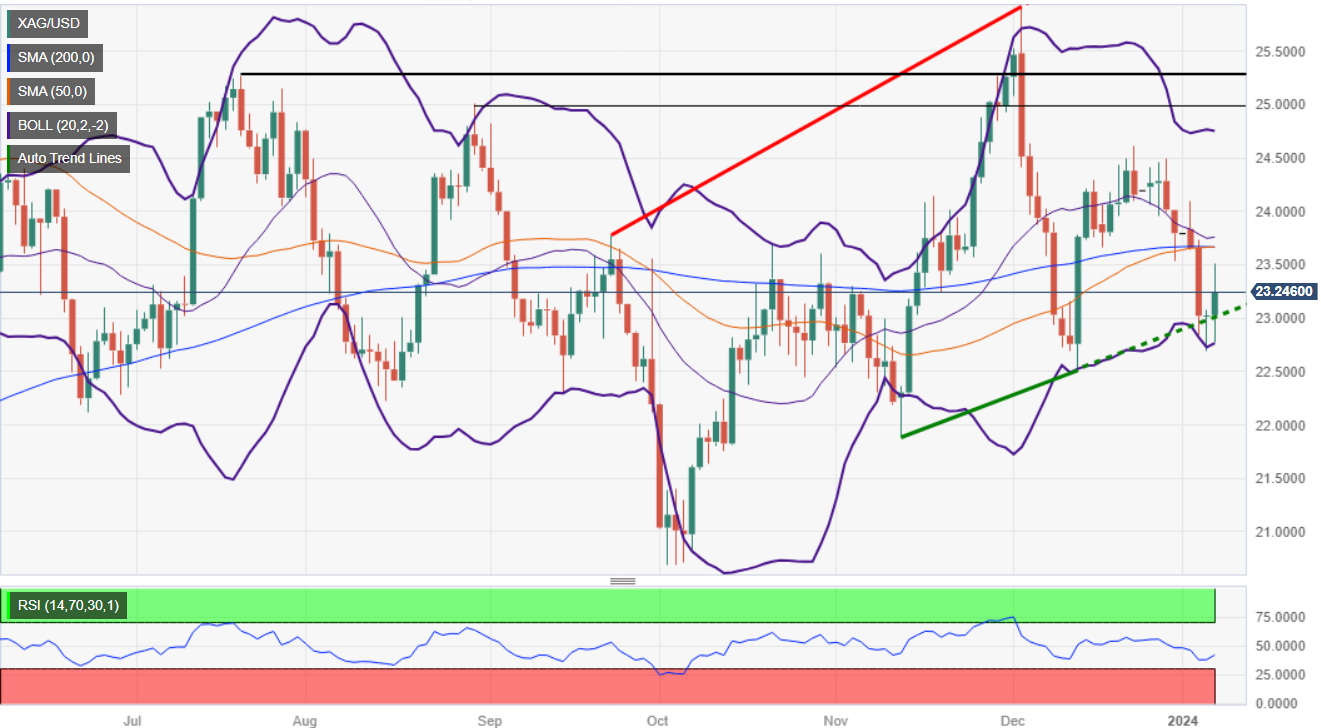
- XAG/USD's potential bullish push towards $24.00 contingent on reclaiming the 100-DMA at $23.30.
- Downside risks loom if Silver falls below $23.00, with targets at January 4 low of $22.69 and December 13 low of $22.51.
Silver price edged higher on Friday, though it retreated after hitting a two-day high of $23.51 after the release of mixed data from the US. A stronger-than-expected jobs report and a jump in factory orders suggest the economy remains robust. Nevertheless, business activity slowed sharply, approaching recessionary levels. At the time of writing, XAG/USD is trading at $23.12, gaining 0.63%.
The XAG/USD daily chart portrays the grey metal as neutral-biased. The 50, 100, and 200-day moving averages (DMAs) are flat, suggesting there’s indecision among traders. If buyers reclaim the 100-DMA at $23.30, that could pave the way for challenging the confluence of the 50 and 200-DMAs around $23.65. A decisive break would expose the $24.00 figure.
On the other hand, if XAG/USD sellers step in and drag prices from around current levels below $23.00, that would exacerbate a test of the January 4 low of $22.69. Once surpassed, sellers could challenge December’s 13 low of $22.51.
XAG/USD Price Action – Daily Chart
XAG/USD Key Technical Levels
XAG/USD
| OVERVIEW | |
|---|---|
| Today last price | 23.22 |
| Today Daily Change | 0.20 |
| Today Daily Change % | 0.87 |
| Today daily open | 23.02 |
| TRENDS | |
|---|---|
| Daily SMA20 | 23.75 |
| Daily SMA50 | 23.66 |
| Daily SMA100 | 23.31 |
| Daily SMA200 | 23.67 |
| LEVELS | |
|---|---|
| Previous Daily High | 23.07 |
| Previous Daily Low | 22.69 |
| Previous Weekly High | 24.49 |
| Previous Weekly Low | 23.54 |
| Previous Monthly High | 25.92 |
| Previous Monthly Low | 22.51 |
| Daily Fibonacci 38.2% | 22.93 |
| Daily Fibonacci 61.8% | 22.84 |
| Daily Pivot Point S1 | 22.79 |
| Daily Pivot Point S2 | 22.55 |
| Daily Pivot Point S3 | 22.4 |
| Daily Pivot Point R1 | 23.17 |
| Daily Pivot Point R2 | 23.31 |
| Daily Pivot Point R3 | 23.55 |
More By This Author:
USD/CAD Price Analysis: Refreshes Two-Week High Ahead Of US/Canada Employment DataEUR/USD Price Analysis: Remains Under Pressure Ahead Of US Official Employment Data
USD/CAD Surpasses 1.3350 As US Treasury Yields Improve, Canada, US Labor Data Eyed


Comments
Log in or sign up to join the conversation.