
Silver Approaching Important Pivot Point
The bulls in the precious metals space enjoyed a brief departure from the violent selling pressure they’re experienced all year, but unfortunately, it’s been short-lived. This is evidenced by silver (SLV) plunging more than 5% thus far this week and gold (GLD) sliding more than 3%. These unpleasant returns are despite negative real rates continuing to remain deeply in negative territory, which is typically a positive backdrop for the precious metals.

Image Source: Pixabay
While many investors are likely frustrated by the selling pressure, it’s important to note that nothing goes up in a straight line, and these pullbacks are entirely normal, as long as key support levels are held. For now, silver continues to hover above its key support area at $22.00/oz, and key ratios also continue to remain in a positive alignment, with the silver/gold ratio above its multi-week moving average. This suggests that this is merely a shake-out vs. a continuation of the 2021 cyclical bear. Let’s take a closer look below:
(Click on image to enlarge)
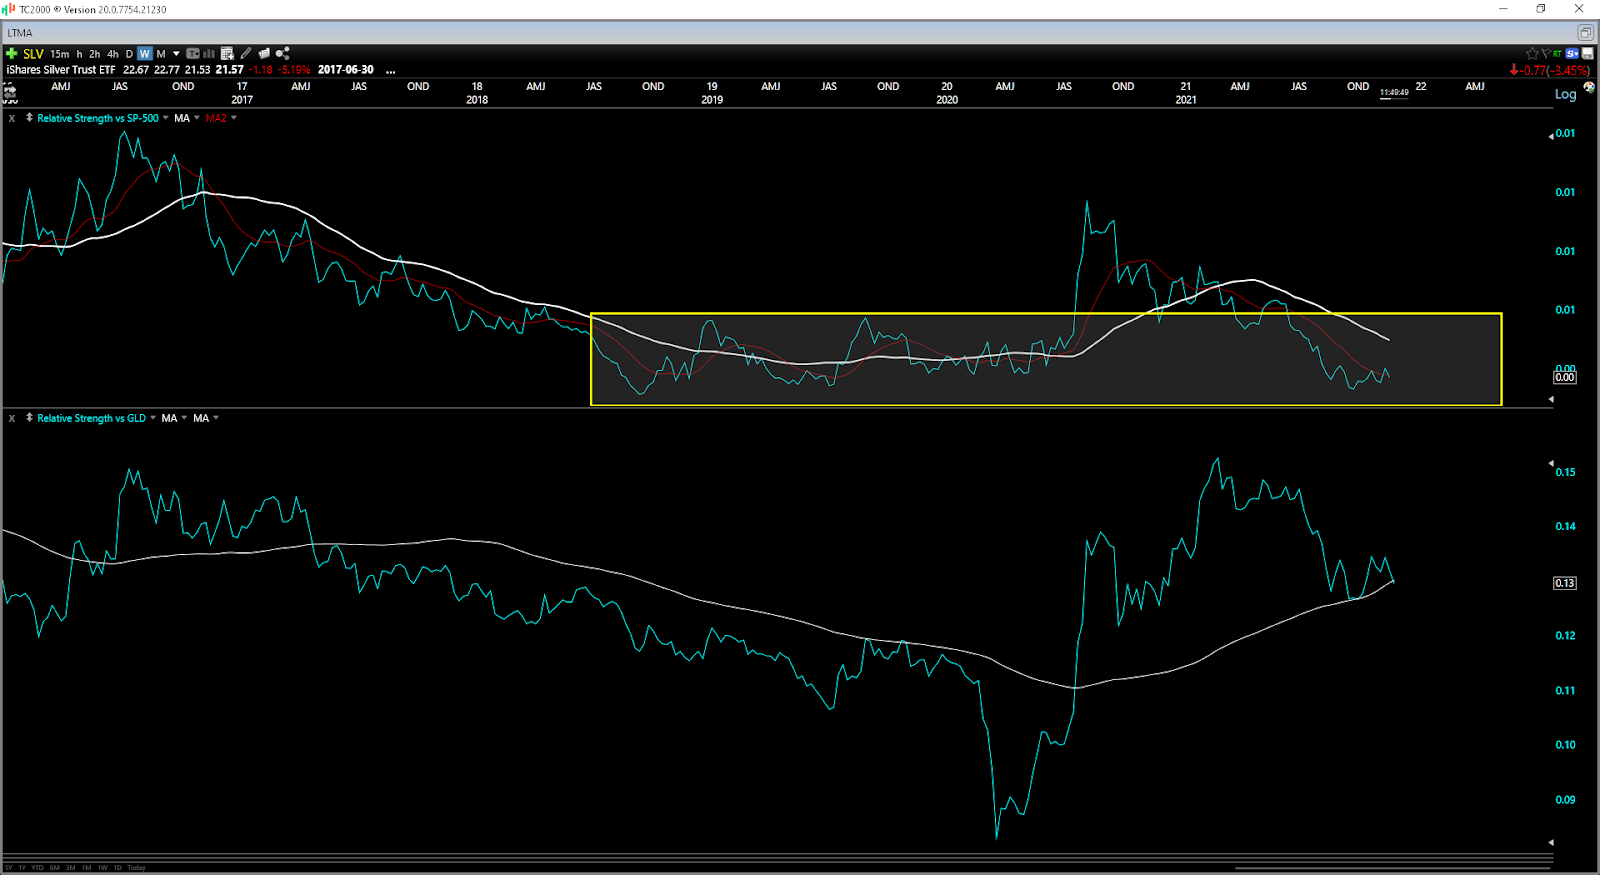
Image Source: TC2000.com
As shown in the chart above, while the S&P-500 (SPY) has enjoyed an incredible return year-to-date, the Silver/S&P-500 ratio is still holding above key support in the base it’s been building over the past two years. While holding support is the bare minimum one would expect, it is a positive sign, suggesting that silver is not breaking down relative to SPY despite its recent underperformance.
If we look at silver’s performance relative to gold, we can see something similar here as well, with the silver/gold ratio hugging its long-term moving average (white line) and still in an uptrend. A major breakdown below this moving average or a lower low would be a very negative development, given that it’s always worrisome when silver is lagging gold, which is not what we typically see in bull markets. However, for now, this ratio remains healthy as well, supporting a higher probability that this is a correction vs. a continuation of this year’s cyclical bear market for precious metals.
(Click on image to enlarge)
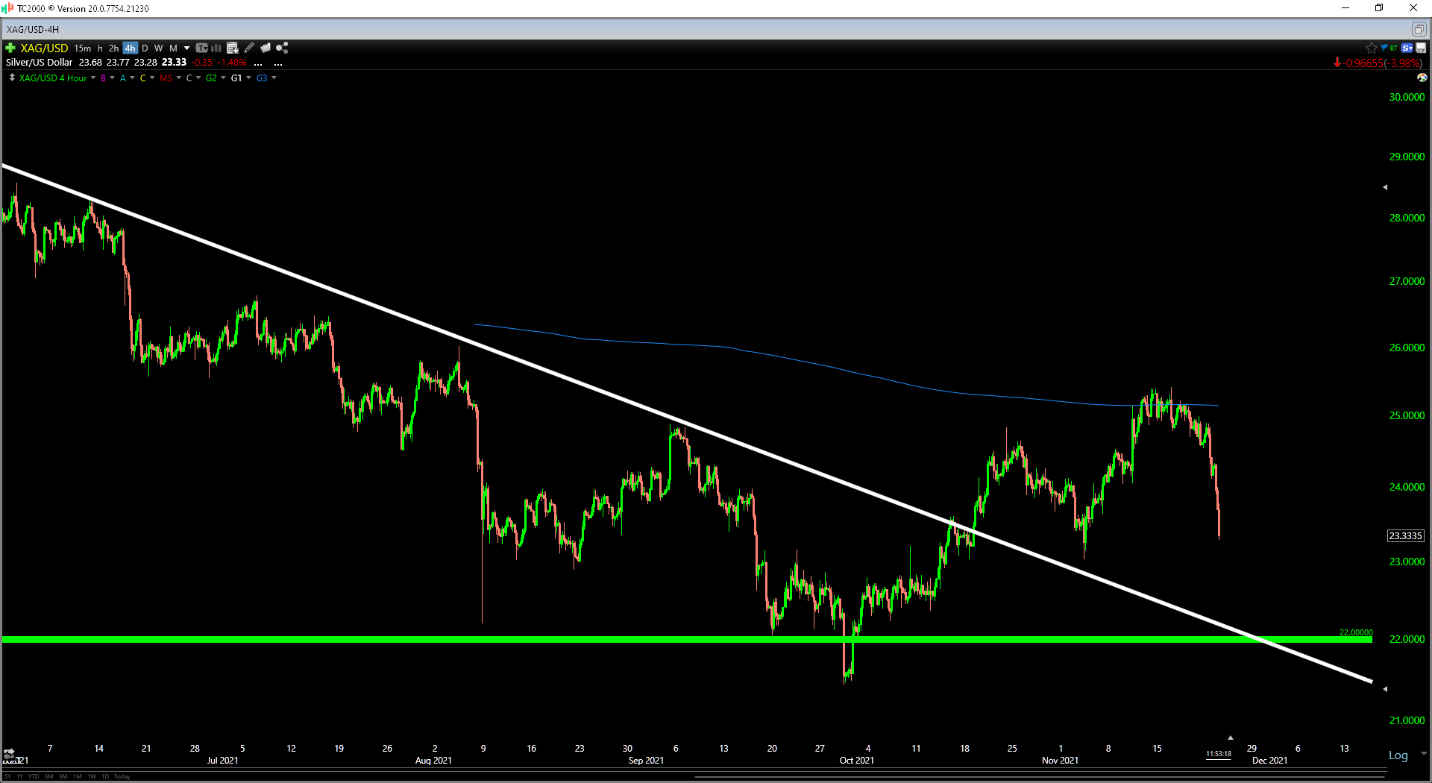
Image Source: TC2000.com
Moving over to the technical picture for silver, we can see that the metal was up 19% in less than 40 trading days, and it’s after these strong rallies that investors become their most complacent and often quite giddy. Anyone that’s traded this sector for more than a decade knows that the last time one wants to be buying is when silver is extended, and investors are patting themselves on the back, hence why it was wise to refrain from buying the past two weeks.
However, the technical picture has improved after this week’s sell-off, with silver now approaching its major support level ($22.00/oz) and within 4% of back-testing its recent downtrend line break. Assuming that the $22.00/oz – $22.50/oz support area holds, I see no reason to lose sight of the big picture for silver, which is bullish. In fact, I believe further weakness below $23.00/oz would present an opportunity to begin nibbling on some of the highest-quality miners in the sector. Having said that, my bullish long-term outlook is contingent on the support level holding.
So, What’s The Best Course Of Action?
As discussed in prior articles, my favored way to play the silver price is Skeena Resources (SKE) as a more speculative play and Wheaton Precious Metals (WPM) for a safer play. In Skeena’s case, the company has a significant silver component at its bonanza-grade Eskay Creek Mine in British Columbia and has the potential to produce upwards of 400,000 gold-equivalent ounces [GEOs] per year at costs below $650/oz. This would translate to 60% plus margins at the current gold price on a gold-equivalent basis. The company is currently working on a Feasibility Study and hopes to begin construction by 2023, which should lead to a re-rating for the stock.
Meanwhile, Wheaton Precious Metals is a royalty play that generates revenue from royalties and streams it holds on different projects globally, and this model allows it to be more insulated from inflationary pressures sector-wide. The stock looks dirt-cheap at less than 27x next year’s earnings estimates with 75% plus margins, relative to a historical earnings multiple of 35. So, if SKE were to drop below $9.90, or WPM below $39.00, I would view these as low-risk buying opportunities. If I preferred to play the metal, I would be using any pullbacks below $23.00/oz to start a position in silver, with a stop below $21.00/oz on a weekly close.
SLV shares fell $0.01 (-0.05%) in after-hours trading Tuesday. Year-to-date, SLV has declined -10.79%, versus a 26.45% rise in the benchmark S&P 500 index during the same period.
Want More Great Investing Ideas?
Disclosure: I am long GLD, SKE
Taylor Dart is not a Registered Investment Advisor or Financial Planner. This writing is for informational purposes only. It does not constitute an offer to sell, ...
more

