
September's Something Special For S&P 500: Weekly Nifty 9
Every week, Finom Group (for who I am employed) constructs a weekly Research Report for investors. The following materials are excerpts from our weekly Research Report. Our goal is to deliver and touch upon all disciplines of investing/trading paradigms such as technicals, fundamentals, and quantitative studies. Enjoy!
Research Report Excerpt #1
There is plenty on the “agenda” (i.e. taxes/infrastructure, debt ceiling, geopolitical concerns, tapering, among others), so we shouldn’t be shocked to see one or more of these issues produce a market reaction, and maybe that is what the market is attempting to “price in” presently. At many different points throughout 2021, we have touched on each of the aforementioned subject matter. Our chief market strategist Seth Golden does a great job of recognizing these issues, but better puts them into investor context for practical capital management purposes. An attempt to summarize his usual commentary on these matters might go a little something like this: “Does it impact earnings, and if so how much?”
I’ll offer my thoughts on each issue, recognizing that Seth’s summarization is the #1 consideration:
- Higher Taxes: mid-cycle elections are coming, nobody wants higher taxes, which is why it’s proven so difficult to pass the latest proposed spending bill and Infrastructure Bill (attached increase in taxes to pay for the bill). Worst case scenario is likely a very watered-down and muted, likely net-neutral tax increase. Minor impact to earnings, but likely something companies can largely offset given taxes are most often increased in strong economic expansion cycles.
- Debt ceiling: Washington D.C. is always a messy place, but a government shutdown into a mid-cycle election year, during the 4th quarter again (like 2018) would prove devastating for both parties. Nobody wants this and I would err on the side of compromise that leads to resolution. If a shutdown, we know it would prove relatively short-lived and with little to no impact on earnings.
- Tapering: Let the media have its day. Aside from the Delta variant, what else do they have to hyperbolize. After all, the results of the last announced tapering plans didn’t produce anything more than a 6% drawdown in a matter of a month (2013). Again, this does not impact earnings, but rather market structure.
Research Report Excerpt #2
In speaking to the constant drumbeat of tapering headlines, which will only elevate going into the September 22nd FOMC meeting, it’s hard to avoid such headlines and commentary on the subject matter that only holds a sample size of… 1! Maybe it’s not all that crazy to see the market finally correct a bit more ahead of any announced tapering plans by the FOMC. Remember, the week before the 2020 Presidential Election, the market corrected 6%, accounting for the potential of a contested election akin to 2000. The market is, after all, a forward discounting mechanism.
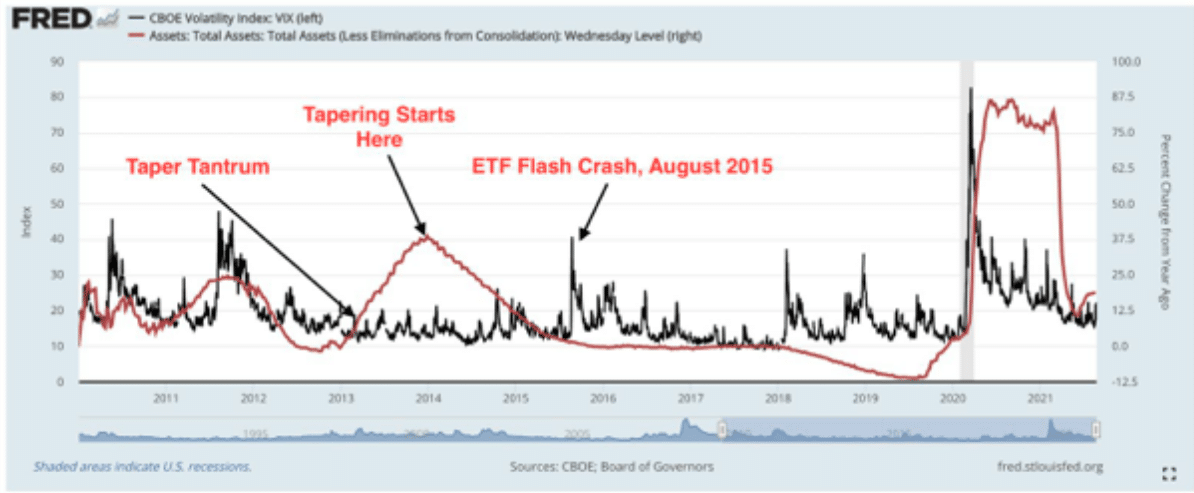
If the market desires to correct for the sake of something that doesn’t impact corporate earnings, all the better I say! Make it rain and improve the market soil for rich harvesting in the future. You’ll notice in the chart above, the tapering announcement of 2013 caused more market volatility than the actual tapering that began in 2014.
Research Report Excerpt #3
Probably, more importantly, is the remainder of this year, given a 7-month winning streak. What might the maximum drawdown be after a 7-month winning streak, and over the next 4-month period? This would take us to the end of the calendar year.
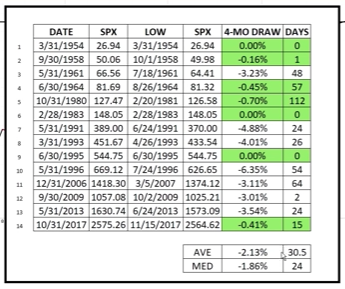
As shown in the table above, after an S&P 500 seven-month winning streak, the maximum drawdown average over the net 4-month period is just -2.13 percent. Sure, in 1996 the drawdown was 6.35% and there are several sub-5% drawdowns. Such data helps us to keep an open mind. In looking at the data presented, do you feel disheartened, informed, and/or encouraged about the coming weeks and months. The fact that the sample sizes in the studies offered is robust also helps to recognize that history often repeats and rhymes occasionally.
Research Report Excerpt #4
The media is making a big deal over the amount of jobs openings available being a couple million above the number of unemployed. That is what the media does. But this has largely been the trend in place since late 2017. (see chart below)
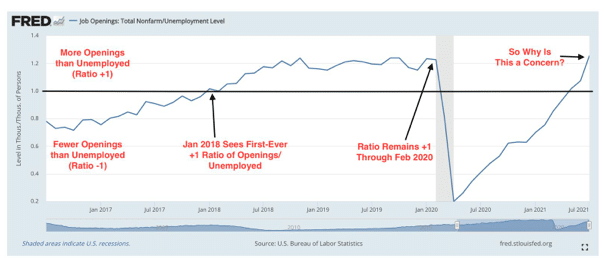
Number of job openings greater than Unemployed has been a trend that was established late 2017. This is not an anomaly! Cyclical peaks in labor market activity came with basically 70-80 job postings for every 100 unemployed workers. That was the “old normal”. The new normal is around 120 postings for every 100 unemployed. There are several reasons for the change. We would single out the growth of industries with higher levels of transient workers (e.g., leisure and hospitality) and the societal shift to intellectual capital which encourages employers to leave job postings up in the hopes of finding fresh talent. The late 2010’s labor market was the healthiest period for US employment since the late 1960s, and high levels of job postings were one positive backdrop. Yes, the August Jobs Report was disappointing, but as long as employers have the appetite to hire (and they clearly do) employment growth should rebound in the months ahead.
Research Report Excerpt #5
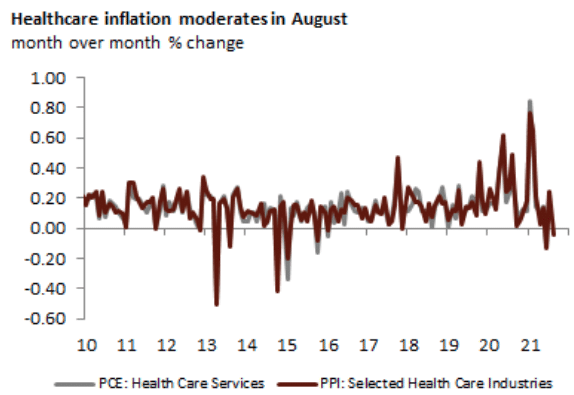
The PPI data implies that healthcare PCE will fall slightly in August. Recall that the PPI healthcare services is used as an input for the PCE Price Index, where healthcare also carries a larger weight than it does in CPI.
Research Report Excerpt #6
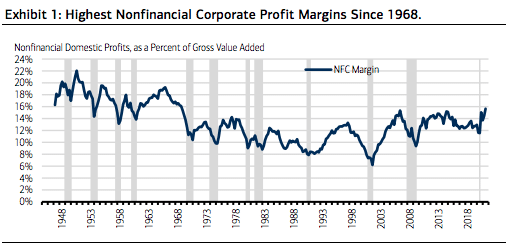
Domestic non-financial corporate profits ran at a 50% annual rate for the quarter and are currently 27% above pre-pandemic levels, a 17.3% annual rate, according to the Bureau of Economic Analysis. The level of profits far exceeds even pre-pandemic estimates of earnings for this year and next, an important reason why equity performance has been so strong. Corporate profit margins are the highest in decades by several metrics. But a number of factors including rising labor costs, fading fiscal and monetary stimulus, and higher corporate taxes is a risk and an eventual peak in margins has important implications for investors.
Research Report Excerpt #7

There are at least 2 ways in which a correction could take place: CONDITIONS or CATALYSTS. At this point 1-year ago (blue), the BIG 5 stocks in the S&P 500 had reached max outperformance of > 60 %age points vs. the other 495 stocks in the index. That CONDITION has not been the case in 2021 (orange line). The conditions were far riper for a correction or deeper pullback in 2020 than today, given that the BIG 5 outperformance was so robust and the BIG 5 would therefore cool off as investors sought other means of generating yield. Without the same BIG 5 performance spread in 2021, it would prove less likely the S&P 500 could achieve a big pullback or correction. Therefore, a bigger pullback or correction would need a CATALYST? The question at-hand now is, “Did the Apple vs. Epic judgement deliver a catalyst that would impact the largest stocks in the market?” If the answer is yes, then indeed, the probabilities for a bigger pullback have increased.
Research Report Excerpt #8
While the monthly Op/EX trend for weekly S&P 500 returns has proven abysmal, there are some months that deliver more bullish returns than others. September happens to be one of those better return months.
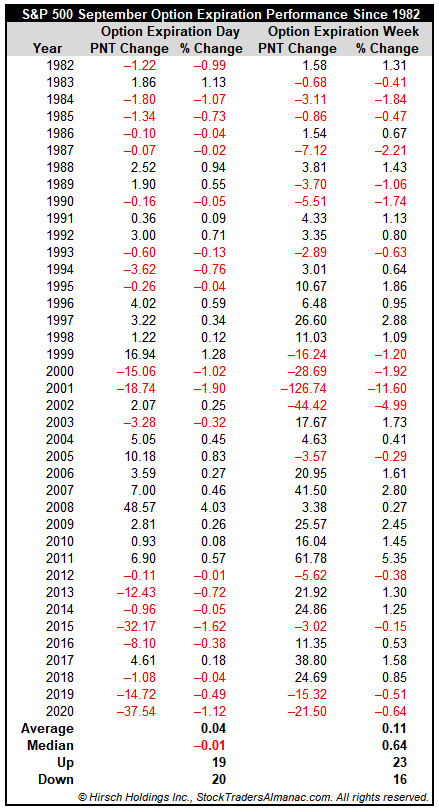
- September’s Op/EX week is up 59.0% of the time for S&P 500 since 1982. DJIA and NASDAQ have slightly weaker track records with gains 53.8% of the time and 56.4% of the time respectively.
- However, the week has suffered several sizable losses. The worst loss followed the September 11 terrorist attacks in 2001.
- In the last 18 years, S&P 500 and NASDAQ are tied for the best record during September’s option expiration week, up thirteen times.
- Friday had been firm with all three indices advancing every year 2004 to 2011, but S&P 500 has been down eight of the last nine since.
Research Report Excerpt #9
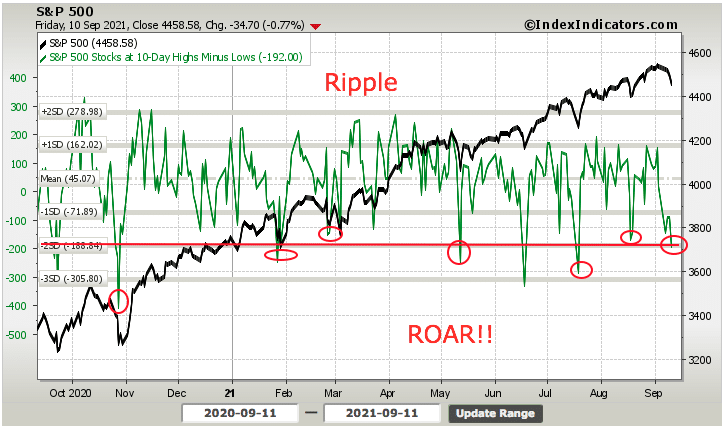
New highs are clearly not expanding/up-trending in the S&P 500 over the last 10 days either. The S&P 500 stocks at 10-Day Highs Minus Lows has actually breached the 2std deviation threshold (-188) as of Friday last week. Don’t worry about the numbers and the fancy jargon, just focus on the chart levels and red line. Since we finished slightly below this threshold that denotes washout levels on Friday, we may get a finally plunge early net week into very oversold territory. What does Ripple and ROAR mean? You’ll notice before every major deterioration in the breadth indicator, it is typically preceded by a ripple, smaller decline in the breadth indicator… and then you have the much bigger plunge for which to act upon as an investor/trader.
Disclaimer: The risk of loss in stock, stock/options, futures, futures/options, and forex trading is substantial, and site visitors and subscribers should consider whether trading these markets ...
more

