
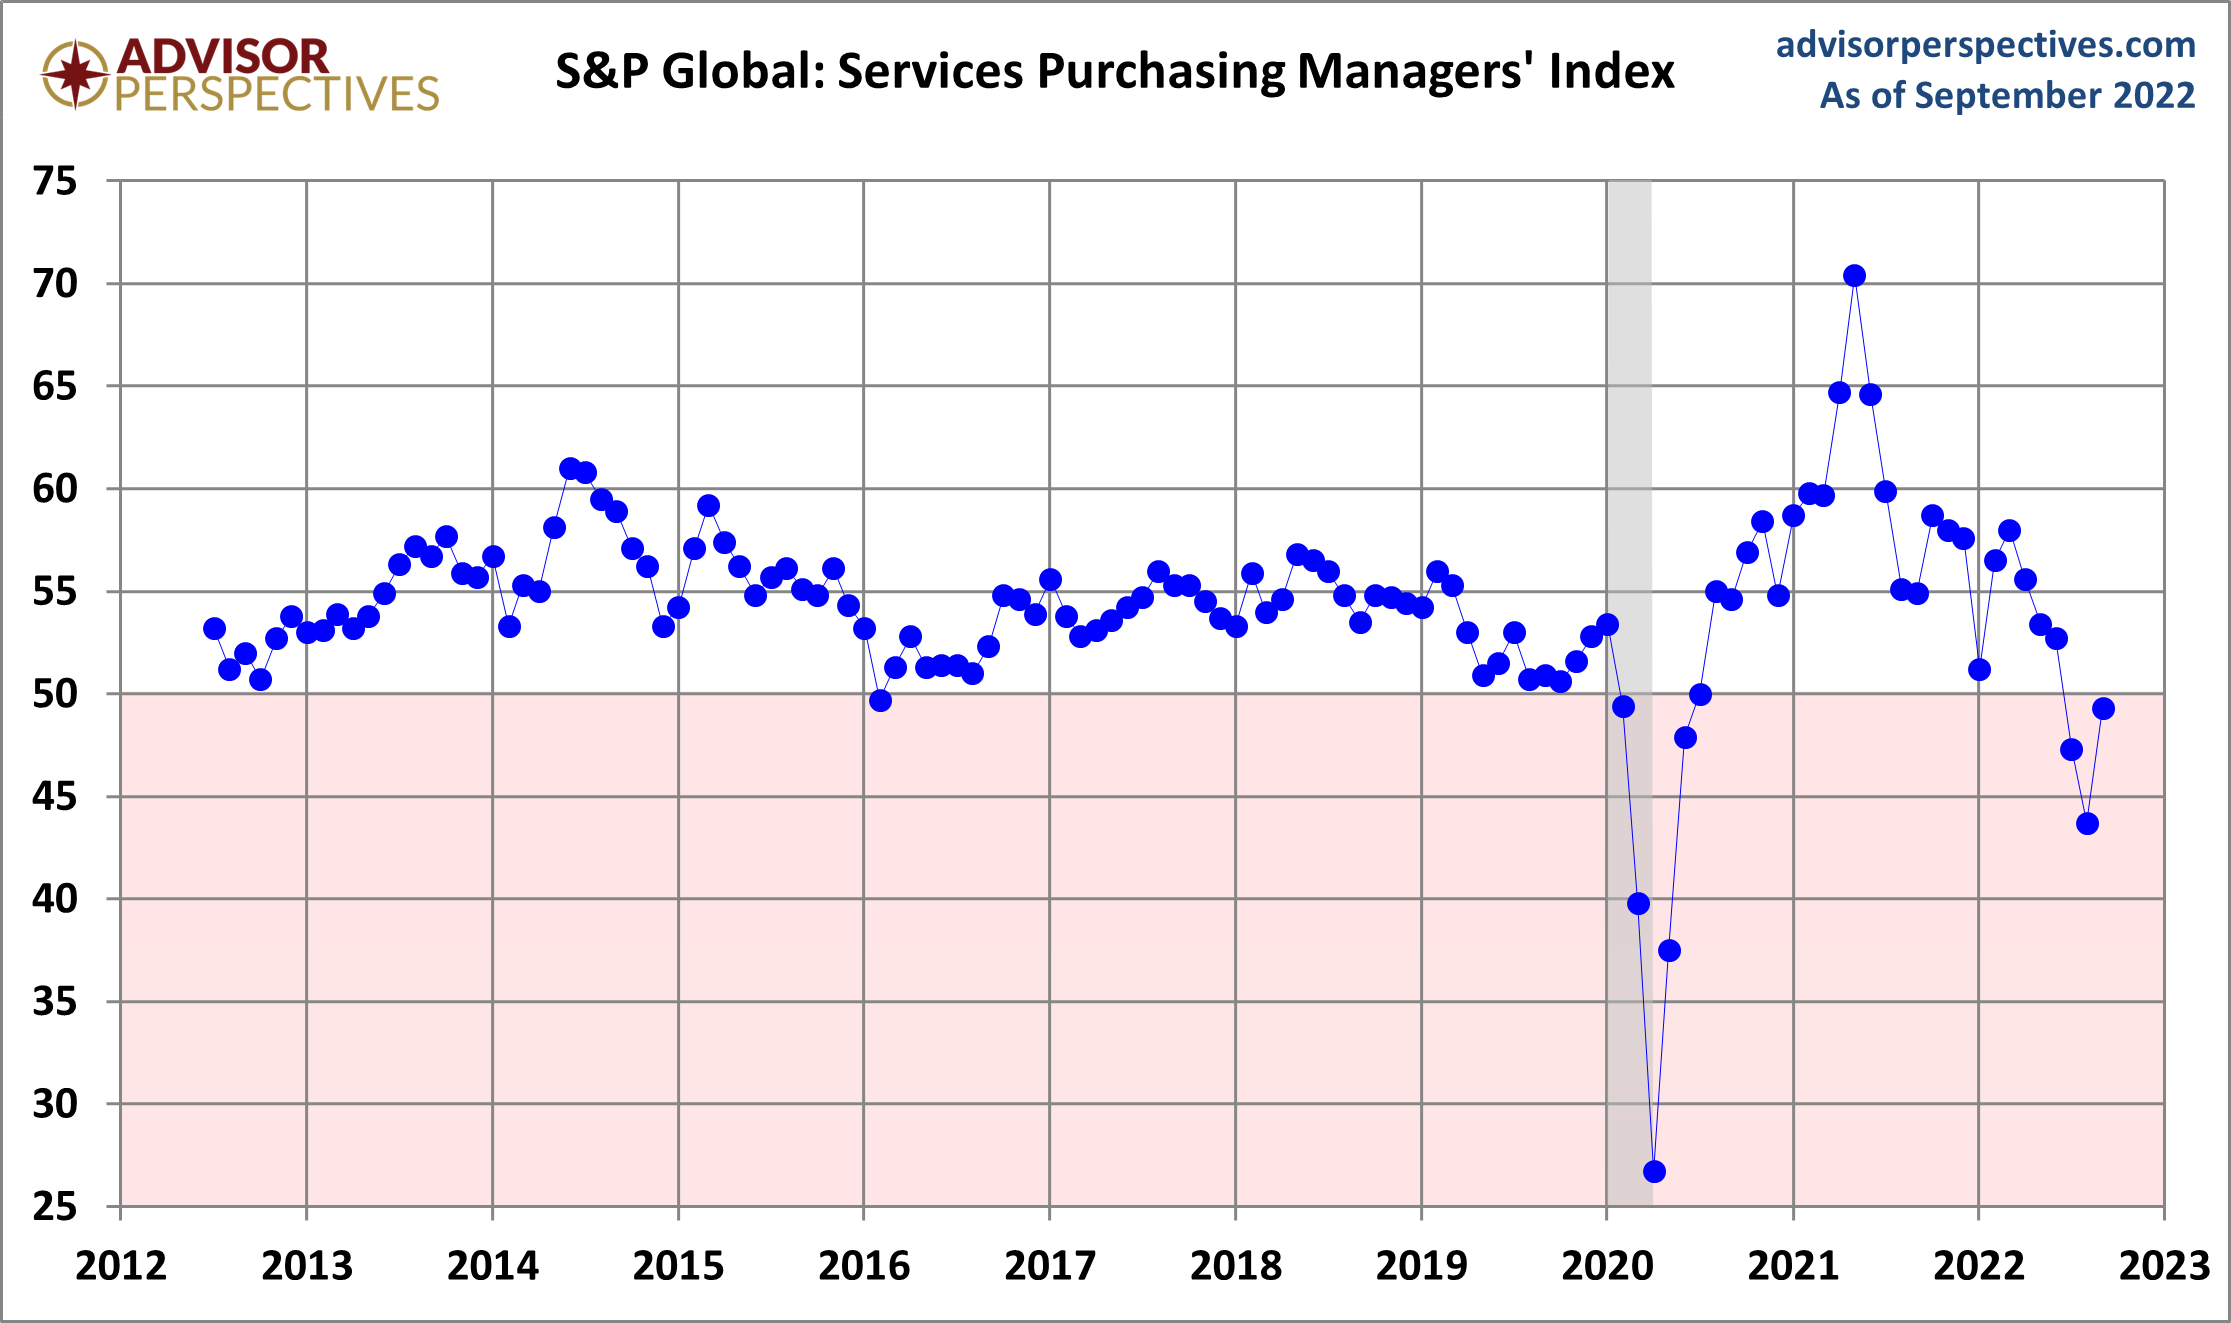
The September US Services Purchasing Managers' Index conducted by S&P Global came in at 49.3 percent, up from the final August estimate of 43.7 and in contraction territory.
From the latest press release, Chris Williamson, Chief Business Economist at S&P Global Market Intelligence, said: :
"With service sector activity declining for a third straight month in September, businesses have faced a tough third quarter. Economic growth has come under pressure from falling output in both the manufacturing and service sectors, though in both cases September has seen some encouraging signals that business conditions may be starting to improve.
"Driving this improvement is a cooling of inflationary pressures in manufacturing supply chains, which is in turn alleviating cost growth for goods and energy in both manufacturing and service sectors, helping stimulate demand and allaying some concerns about the economic outlook.
"The worry is that tightening financial conditions, and notably higher borrowing costs, are exerting increased cost pressures on households and businesses, as well as hitting growth in the vast financial services sector, which has seen the steepest downturns in both demand and business activity in recent months and saw yet another marked worsening of business conditions in September.
"Furthermore, despite easing, inflationary pressures in terms of firms' costs and average selling prices for goods and services remain elevated. With companies also reporting staffing issues and rising wages due to very tight labor market conditions, persistent inflation remains a concern at the same time that the economy appears to be struggling to regain momentum."
Here is a snapshot of the series since mid-2012.
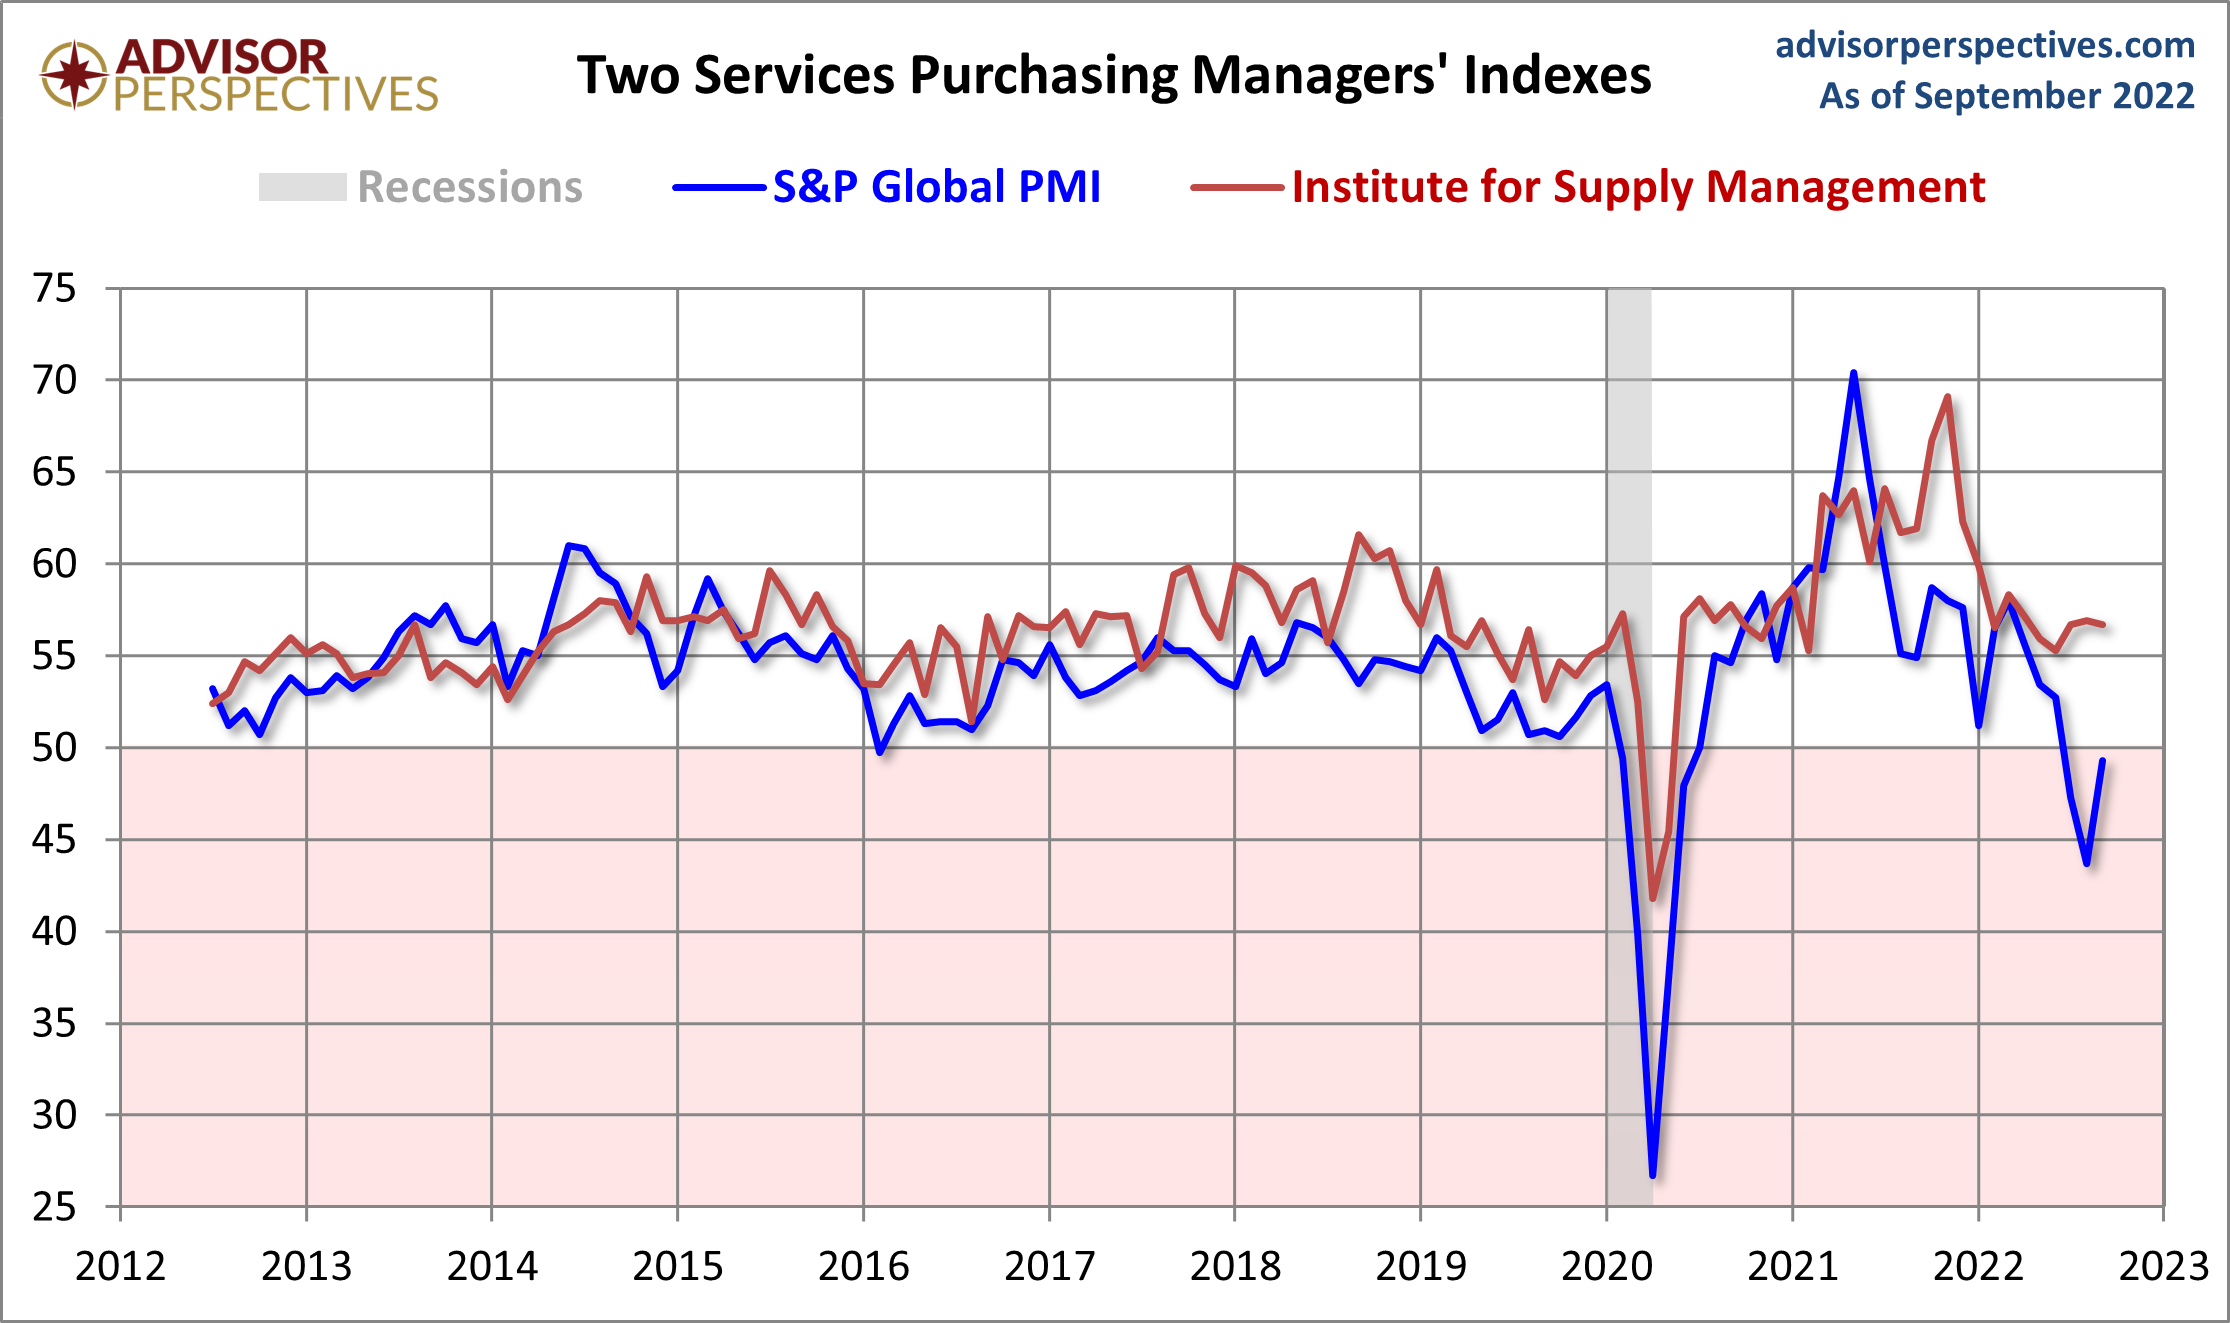
Here is an overlay with the equivalent PMI survey conducted by the Institute for Supply Management, which they refer to as "Non-Manufacturing" (see our full article on this series here). Over its history, the ISM metric has been significantly the more volatile of the two.
The next chart uses a three-month moving average of the two rather volatile series to facilitate our understanding of the current trend. Since early in 2016, the ISM metric has shown stronger growth than the Markit counterpart.

More By This Author:
August Trade Deficit at $67.4B, Beats ForecastTreasury Snapshot: 2-10 Spread At -0.48%
Weekly Gasoline Price Update


Comments
Log in or sign up to join the conversation.