
Semi Sector: A Warning Or A Buy?
We began tracking this negative divergence in NFTRH last year as the leadership of two premier Semi Equipment companies began to decelerate vs. the broad sector.

Over time the ugly patterns became even uglier with breakdowns to new lows. This chart shows that ugliness but more importantly it tries to illustrate AMAT & LRCX as leading indicators for the broad markets. In 2013 it was a big part of the macro signaling that told us to prepare for a coming economic upturn. In late 2015 it told us that the market top of that time probably was no such thing.

Now what? The word from the Equipment companies like Lam Research and from some analysis by SEMI has been that the sector is looking at slack in the supply rope. It’s not taught. It’s loose. The forecasts have been for things to ramp back up again by the end of the year or in early 2019. This view was bolstered by my ‘boots on the ground’ industry contact. Ah, forecasts…
Also posted at SEMI comes this article from industry analyst Walt Custer.
Strong 2Q’18 Global Supply Chain Growth But Second Half Slowing
Either ole’ Walt has not read the headlines about a temporary supply glut or he’s not buying it, on face value at least. Maybe he has been around the industry long enough to know that forecasts are made to be revised; especially in the Semi sector. He’s just going by the cut and dry numbers.
The article basically calls what we already know; that Semi equipment sales have backed up. Read the whole thing (it’s very brief) if you’re interested. But he notes, along with the following chart…
Semiconductor capital equipment sales are historically very volatile, with their growth fluctuating MUCH MORE than electronic equipment (Chart 4). However, both series appear to have peaked on a 3/12 basis for this current cycle.

Now, what is he calling a cycle? He drew an arrow at the latest downturn in volatile equipment growth rates. I inserted notes about the last 2 ‘cycles’. The thing is, it’s really been one ongoing expansion since 2012.
So here you see illustrated my question about whether or not Semi Equipment is leading the broader economy to the downside in a reversal of its effect in early 2013. Point being, were that a stock chart I’d be preparing to buy it, not sell it.
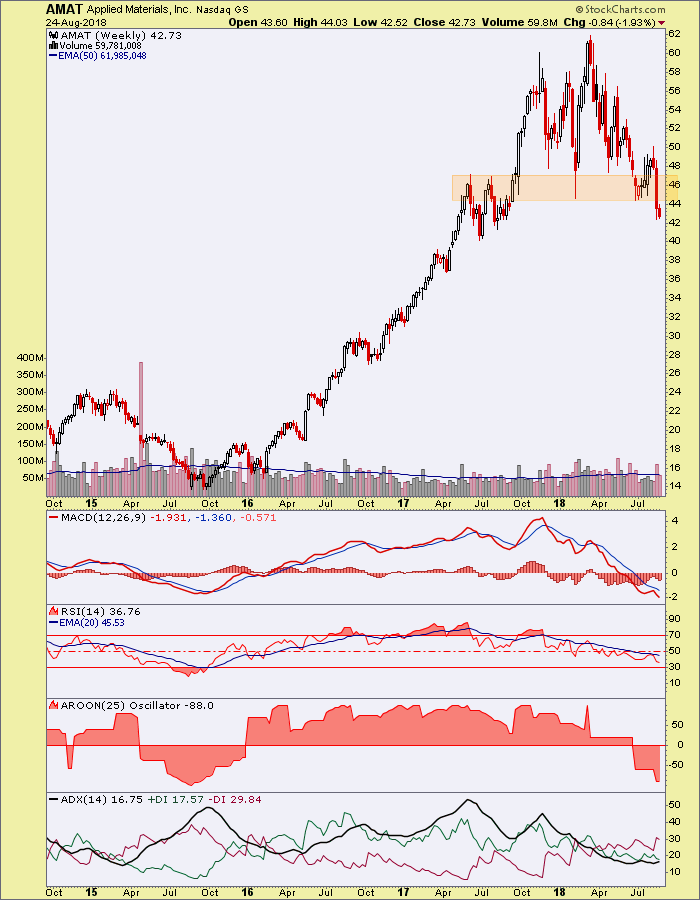
Which leads us to some actual stock charts. Semi Equipment company AMAT looks completely brutal below former support, now resistance.
Fellow Equipment guy LRCX is in an ugly pattern and at a support area, with last ditch support shaded around 160.

Chip maker INTC really needs to hold the 46 area or it could be a long way down to 35.

MCHP as well would go really bearish with a breakdown from this support level.

And finally, there is the Semi Index in a weird looking Diamond consolidation. Except that maybe the front end of the weird looking Diamond is actually a Symmetrical Triangle (bullish continuation).

I already beat NFTRH subscribers up with too many charts this weekend. So now I’ll beat the public up a bit. Many indexes, sectors, individual stocks and indicators are saying similar things; decision points ahead! Directly ahead. Keep your thinking caps on and try to manage your bias.
Subscribe to NFTRH Premium for your 40-55 page weekly report, interim updates and NFTRH+ chart and trade ideas ...
more


Looks like a triple bottom test - Going higher?? - but definitely not fool proof.