
Secular bear markets begin from a point of mass exuberance and over-valuation and end when they have crushed both into remission.
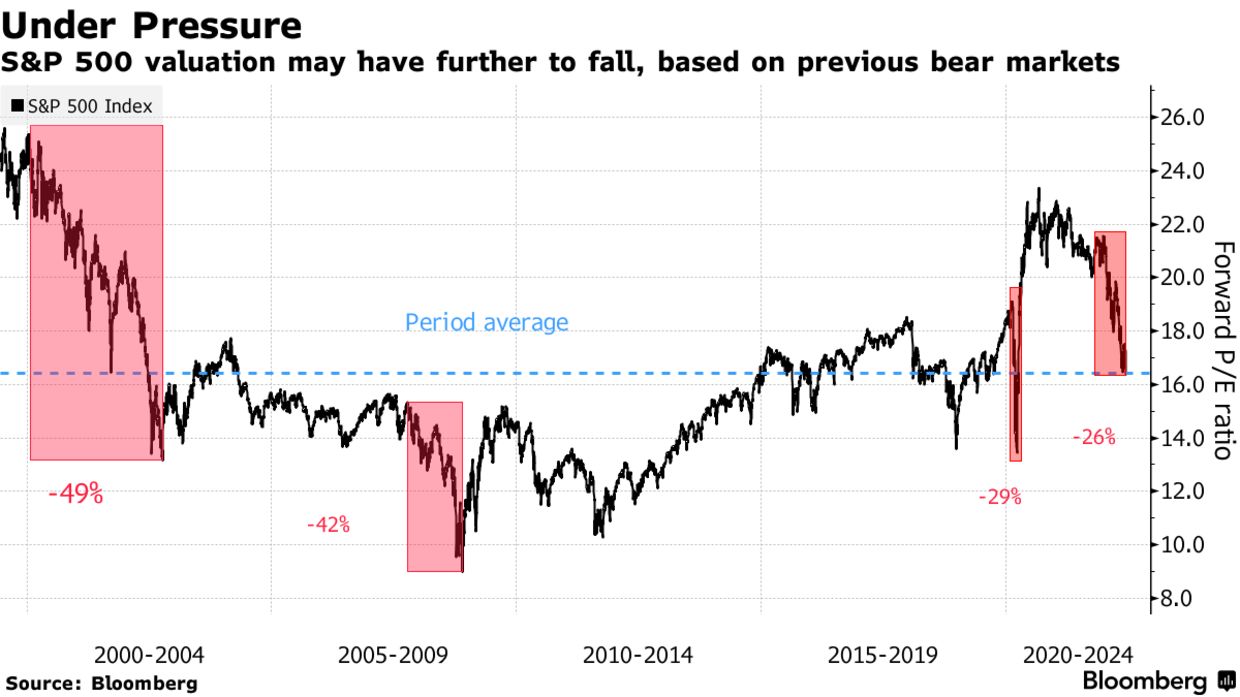
The forward price to earnings (PE) estimate for the S&P 500 in 2000 was 26 versus a long-term mean of 16 (as shown below). It fell to the 22-year mean of 16 in June, but consensus earnings estimates (the E of the ratio) have not yet been reduced for the reality of an incoming recession.
As the consensus inevitably lowers the profit outlook, further price compression will be needed to move P/Es below the mean. Simply touching the long-term mean isn’t sufficient; restoring it requires an extended period (years) where multiples are below 16. Bear markets have bottomed over the past 50 years when the price reaches 10 to 12x forward earnings estimates. Thus, the ultimate PE compression in this bear cycle may be about half complete.
(Click on image to enlarge)
In the rare occurrences where recessionary downturns have begun from similar euphoria in sentiment and asset valuations (1929, 1966, 2000, 2008), the following bear market has taken back all, or nearly all, of the previous bull cycle appreciation.
From 1553 in January 2000, the S&P 500 tumbled 50% over 33 months (as its PE compressed 49% shown above), with the price bottoming at 768 in October 2002. It then spent over eight years growing back losses, briefly revisiting its 2000 price peak by July 2007. From there, the widely benchmarked index round-tripped -57% over 20 months to a new secular low of 666 in March 2009 (as its PE compressed 42%).
The tech-heavy NASDAQ index reached a delirious 42 times expected earnings in 2000 before it collapsed 78% and spent 15 years recovering its 2000 secular top by 2015.
Canada’s TSX index peaked a few months later than the S&P 500 in 2000, topping out in September on Nortel mania and naive beliefs that Canadian stocks would decouple from a global bear market. The TSX halved from 11,400 in July 2000 to 5,678 by October 2002. Recovering its 2000 peak in 2006, it briefly overshot to 15,526 by June 2008 on unsustainable commodity demand driven by the US housing bubble and China. It then followed the S&P 500 into another 50% swoon, bottoming in March 2009 at 7882.
As shown below by my partner Cory Venable, it took seven years for the TSX to reclaim its 2008 cycle peak, touching 15,000 in 2015-2016, briefly overshooting it in 2017-2019, before tumbling back to a 13-year low in March 2020. The two-year double from the low in March 2020 to a new all-time peak by March 2022 was an anomaly reminiscent of the NASDAQ’s dubious doubling in 1999 (before it imploded).
(Click on image to enlarge)
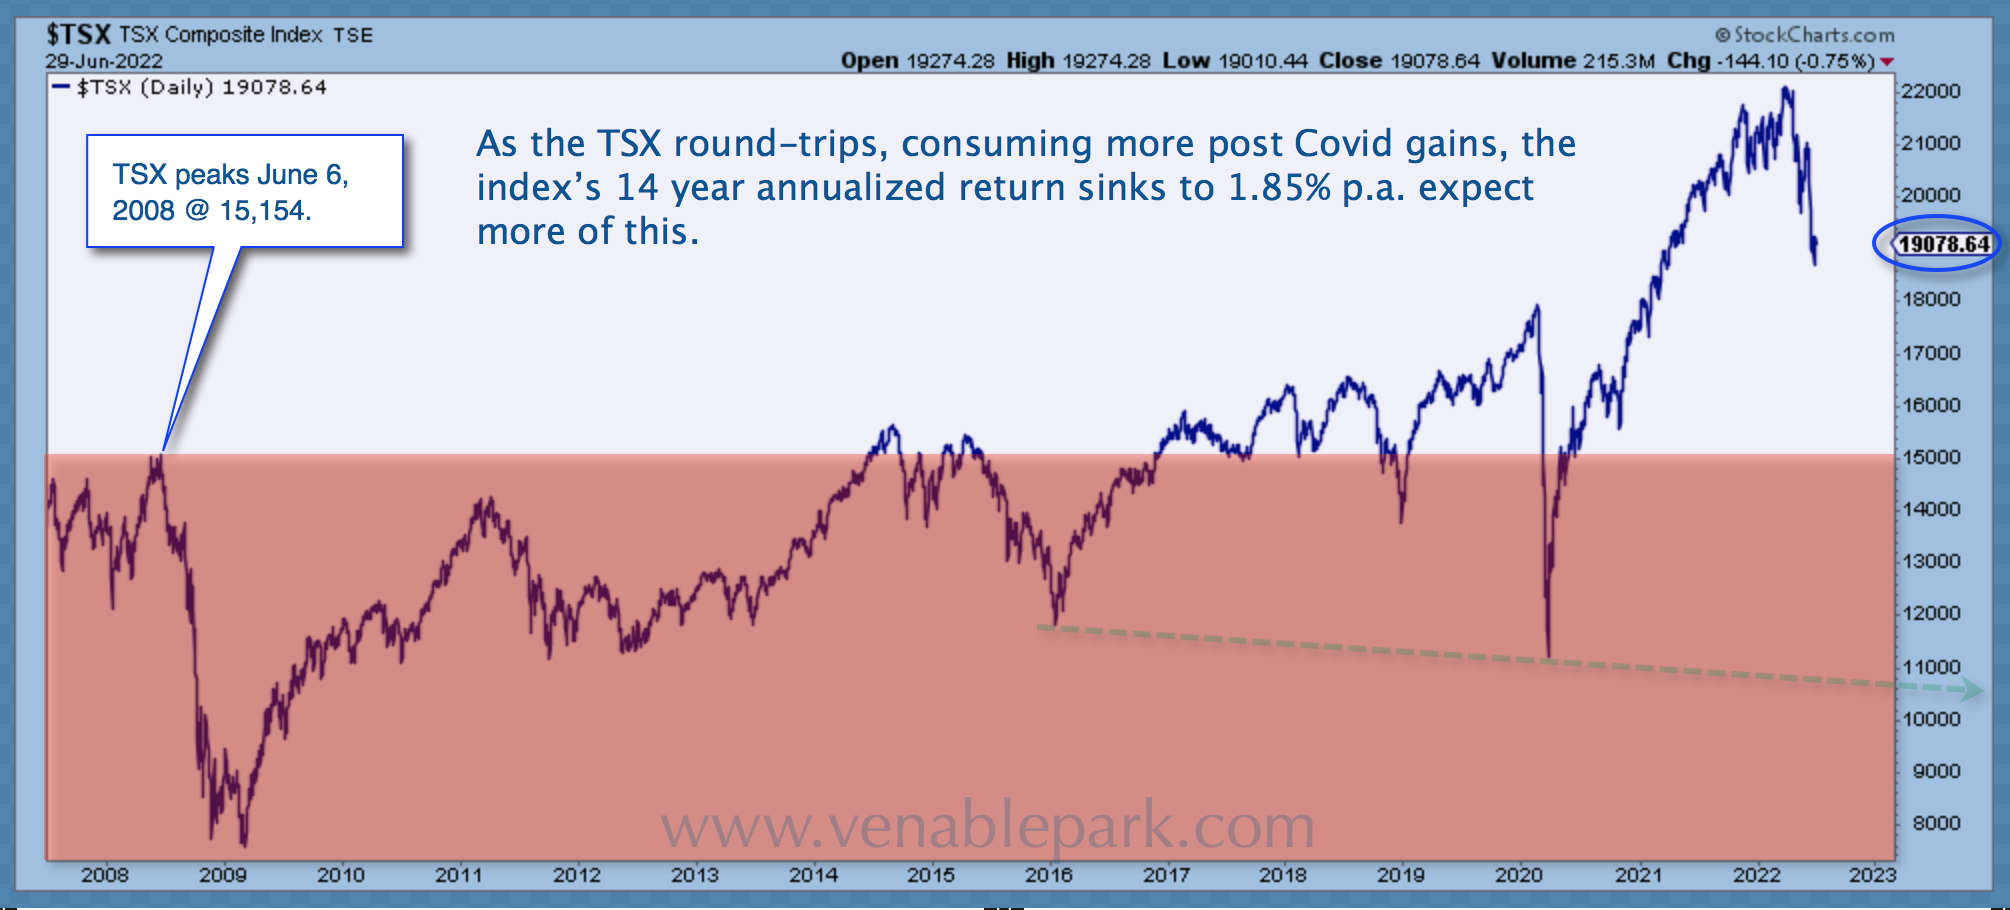
The relatively mild 14% decline since March brings the TSX just 800 points (4%) above its pre-COVID February 2020 high of 18,000. The annualized capital gain for the Canadian stock market over the past 14 years has fallen to 1.7% per year from 1.85% at the end of June. Another 20% decline (a highly probable retest of the 15,000 level shown in red above) will make the index’s annual annualized capital gain since 2008 less than zero.
If stock indices retest their March 2020 lows (our base case this cycle), a lower low is plausible–green dotted line for the TSX noted above around 11,000–and mark a peak to trough decline of 50% from March 2022. If the TSX holds there, that would be a more favorable outcome than the previous recessionary bears that erased 100% of the prior cycle gains (taking the TSX back to its March 2009 low of 7882). We can hope for the milder bottom, around 11,000, but at this point, even that will be crushing for most market participants that have wrongly bet “this cycle is different.”
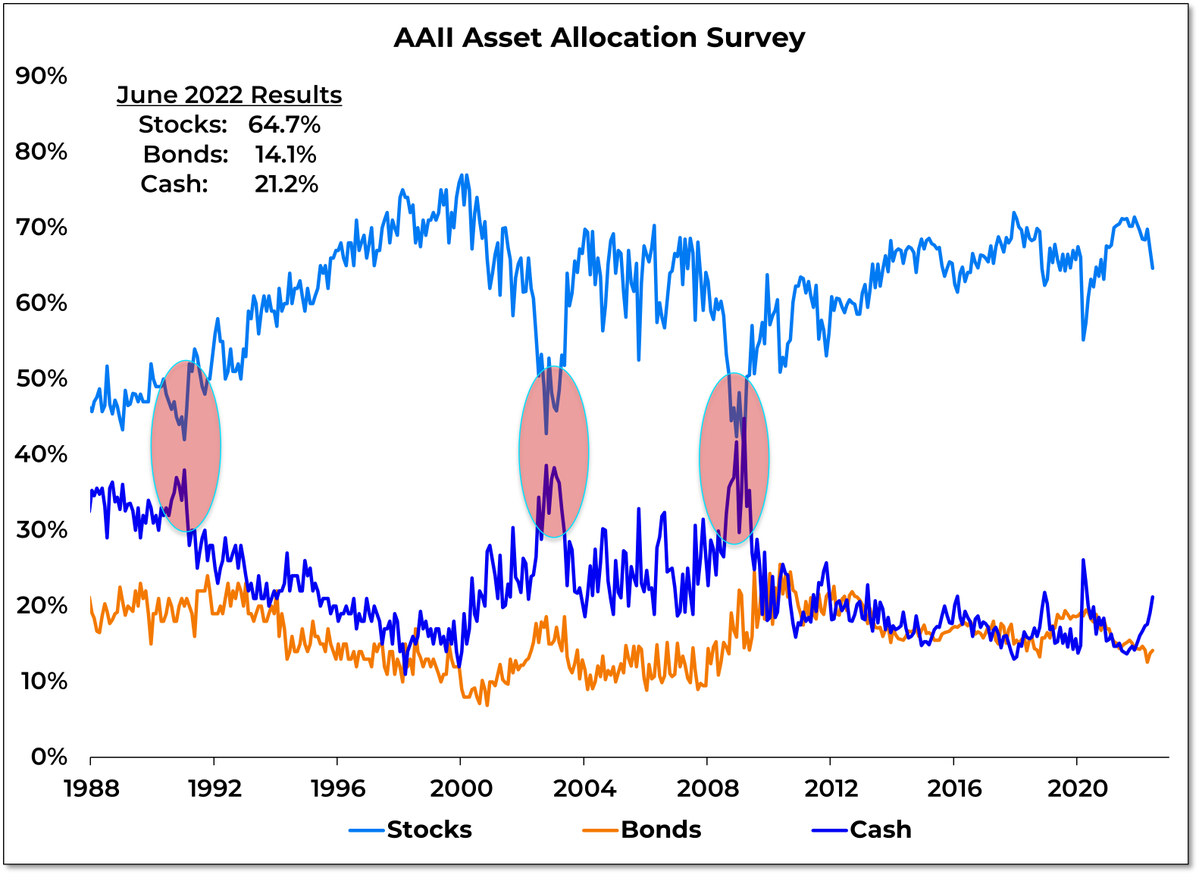
Despite the negative first half in 2022, at the end of June, individual investment accounts were still nearly 65% allocated to stocks, 21% in cash, and just 14% in bonds (as shown below since 1988). Bear markets have never ended before median stock allocations drop toward 40% in favor of cash and bonds. This is just one of the historically reliable sentiment indications that we are not through this bear yet, and an above-average loss cycle is due.
(Click on image to enlarge)
Like its performance year-to-date, Canada’s TSX fell 15% between October 2007 and February 2008. At that point, the long-always consensus kept urging that buying was the thing to do. In a February 2008 video interview with a Financial Post columnist (available here), I disagreed and explained why. At that point, I was taking a lot of heat for suggesting markets could revisit their prior cycle lows, but that is what happened over the next year. Fourteen years hence, here we are again, for many of the same reasons.
More By This Author:
Recessions squash inflation and risk assets
Retail capitulation yet to come
Big bounces par for bear market course

Comments
Log in or sign up to join the conversation.