

Image Source: Pexels
I grew up on the shores of Lake Erie. From a very early age my parents enjoyed boating. Their passion grew from a small (24’ wood boat) to larger, pleasure boats (41’) as I got older. Nothing made my late father any happier than being out on the water in his boat.
However, sometimes the lake was rough, and then it wasn’t much fun. I remember getting sick from being tossed around from the rough seas, because Lake Erie is the shallowest of the Great Lakes. As a result, it can get rough extremely quickly when the wind picks up.
I was on some very harrowing trips when the lake whipped up quickly and the lake grew ferocious by the minute. I recall transitions from calm summer fun to the tumultuous chaos of 6-to-10-foot waves taking only minutes. These transitions resembled the 2022 stock and bond markets, especially when unfavorable news comes out.
This past week started off with a positive Monday. Then Tuesday’s August CPI (Consumer Price Index) date was released. Instead of the expected pullback in the monthly inflation numbers, the readings were slightly hotter. And the year-over-year inflation numbers stayed elevated at 8.3%.
The expectation was that the decline in energy prices (gasoline) would offset other inflationary prices. Energy has declined, but food and rents continued to climb.
After the release of the data early Tuesday morning, the market turned negative very quickly. Most analysts and market pundits were expecting to see the previous rate hikes begin to soften the rate of inflation.
Their thesis was that if we saw slower inflation numbers, the Fed would be inclined to pivot and raise rates in a smaller increment next week at their upcoming meeting. With the unexpected new data, all bets are now on that the Fed raises by at least 75 bps. Some economists, like Larry Summers (ex-Treasury Secretary) are insisting that the Fed should be even more aggressive and raise as much as 1.0%. That would be unprecedented.
The stock market went on a severe nosedive (the worst since June 2020) and interest rates headed towards new highs (the 2- and 5-year US Treasuries hit new highs, the 10-year did not). The lingering inflation picture is captured below.

Then on Wednesday, the PPI (Producer Price Index), which is the Fed’s more closely-watched index, came out and backed up the higher inflation story from the previous day.
More negative news hit Thursday night when Fed Ex conveyed to the world that a major slowdown was occurring worldwide, especially in China and Europe. Consumer Sentiment also came in with disappointing numbers on Friday morning, and this exacerbated an already dismal week of news.
Fox financial news anchor Charles Payne recently pointed out that if they were still doing the calculations based on the methodology from the 1970's-1980's, inflation would be around 16% right now. However, the government changed the way it calculates these inflation indices by using different weighting. See below:

It was a rough week in the stock and bond markets. The S&P 500 ended down 5.2% from last Friday, the Nasdaq 100 was down 5.8%, and the small-caps (Russell 2000) held up a bit better, but were still down -4.5%.
Is this the bottom, or will we see more selling? We don’t know, but our indicators have been risk-off for several weeks now. Several of our investment strategies are heavily invested in cash.
Recession Ahead?
As noted above, interest rates have been rising most of the year. In fact, for holders of Fixed Income (“bond”) funds, including variations like Preferred Bonds, Convertibles, High Yield, and even Municipal bonds, 2022 has been a negative year. Historically, this is the worst year for what are typically referred to as “conservative” and low risk instruments. The returns range from down -6% to over 15% for most of these “bond” funds.
And for many Americans, these hold a sizable place in their overall portfolio and are supposed to provide the income they rely on. The double-edged sword is that most investors invested in these types of funds are not only losing principal, but the income they produce is less than inflation. Most pension plans are severely underfunded and will not be able to cover their obligations, and they could default in the next decade.
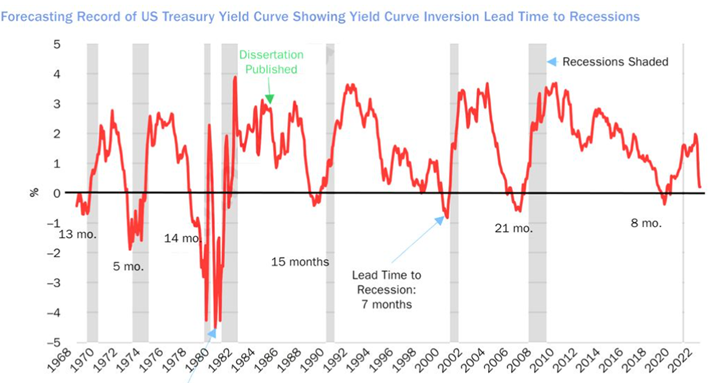
The Federal Reserve watches the yield curve closely. Recently, the 2-year US Treasury note has been yielding approximately 2.78% and the 10-year US Treasury has been yielding 2.44%. That means we have an inverted yield curve of approximately -34 basis points. This has always forecasted a coming recession. See chart below:
Looking at other areas of the yield curve, we have not seen this big of an inversion between the 2-year and 30-year Treasury Yields since 2000. See below:

Are we already in a recession? Many economists believe so, but if we are not, we suspect we will be soon.
Corporate Earnings are Falling
In these columns, we have frequently discussed earnings contractions coming soon to US companies. This is due to many factors, such as rising labor costs, health care costs, material costs, transportation, distribution costs, and a potential (and real) slowdown of business due to demand destruction and non-affordability factors.
On Thursday night, Federal Express Corp. (FDX) provided guidance that their business is slowing quite rapidly. They attribute much of their business weakness to China (again shutting down business due to COVID-19 concerns) and Europe, which is already in a recession. Their concern for a global recession forthcoming (if not already) caused the stock to sell off by 22% on Friday. See chart below.

At the beginning of 2022, Federal Express had a market capitalization of $70 billion, and it was (and is) a staple of American companies, providing important shipping for the supply chain. Today, this company is worth roughly $40 billion and it has seen 40% of its market capitalization evaporate overnight.
This may be one of many shoes to drop from corporate America. Below is a table of Yardeni Research estimates of earnings for the remainder of the year as compared to a large universe of Consensus Forecasts:

We want to provide you an easy way to calculate the fair value of the S&P 500 and where this market may go if it factors in these earnings estimates. Please note that a favorable Federal Reserve environment is when they are in an accommodating mode. This means keeping rates lower than inflation or lowering rates. This low cost of capital keeps earnings growing with PE multiples staying on the higher side (18-22x earnings typically).
When the Fed is in a non-accommodative mode, raising short-term rates and/or draining liquidity from the system, we would most likely see a contraction of earnings estimates. In that case, multiples would likely fall to a range from 12-16x earnings, or even much lower during recessions.
The chart above shows the Consensus Estimates of analysts and economists on Wall Street. Ed Yardeni of Yardeni Research does an excellent job of providing his detailed analysis. He shows a much smaller growth projection (3.1%) for the year of 2022.
Doing the arithmetic, here are some high-low estimates for the S&P 500 value. Since the market is always looking ahead, this would most likely happen in the next month and certainly prior to the end of the year:

It is safe to say that if there are more companies like Fed Ex who will adjust their earnings estimates, we may see the lower side of the above estimates. If, however, we have a soft landing and growth picks up going into 2023, we could see the higher side of the ranges above. The median of these estimates is about 3600 on the S&P 500, or where we were in June 2022.
The Line in the Sand (3900 Trendline Broken)
This Friday, an important market support line was broken. Many analysts and market pundits have been conveying in their subscriber updates that the S&P at 3900 would likely hold, and they felt that it was an important point to watch for.
Like a hot knife going through butter, the market pierced 3900 on Friday and closed below there (and below both the 50- and 200-day moving averages). Notice that support lines below:

Home Buying is Coming to a Screeching Halt
We have long commented that when housing becomes unaffordable, it will have a dramatic effect on slowing the economy down further. Today, mortgage rates hit the highest they have been at since mid-2008. Mortgage applications have basically stopped. See chart below:

Affordability in housing is determined by one’s pay (free cash flow), housing prices, and the mortgage rates. Given the escalation of housing prices the past few years (up on average 20%-30% in most parts of the country), purchasing a new or upgraded house has become out of reach for many buyers.
And as reported in the CPI numbers last Tuesday, rents have gone up to an average price of $2500, suggesting that people cannot even afford to rent an apartment. This will further affect earnings of housing-related companies and force more corporate revisions downward.
Eye of the Storm
A few weeks back, we shared with you that September can be a difficult month for the stock market. This is further amplified during midterm voting years. We want to remind you that beginning Sept. 12, through the end of the month, this period can be a very volatile and choppy period.
Was it a coincidence that this past Tuesday (Sept. 13) was the point in which the market’s new leg down began? Please invest carefully during this period. See chart below:

4 Actions You Can Take for a Smoother Investment Ride
- Move to cash or take some amount to protect you from the storm. We have been recommending this for most of the year. For some reason, people keep sharing with us that their financial advisors do not want to let them do this (or by their firm’s policies). Cash is an asset class. Use it to preserve capital. During a bear market it is not who makes the most money, but who loses the least.
- Invest outside of the mainstream markets. This entails using stock inverse (short) funds, commodity ETFs, rising interest rate ETFs, and others that you will find in some of our investment strategies.
- Use stops. How do you know that stock is going to come back? Some stocks are so far underwater from where people bought them (PayPal and Shopify are two that come to mind) that it may take years to get back to even. Cut your losses. Losing stocks can become greater losers. Did you know that Meta Platforms (FB) and Microsoft (MSFT) hit new 52-week lows on Friday? Even the best stocks can turn into losers.
- Watch the trends. We frequently discuss bull and bear market phases. We also coach our subscribers on how to avoid investing in an unfavorable trend. Long-term, they are easy to see. A simple graph below shows the past few month’s trends. It is important to gain a different perspective.

Here are additional observations.
Neutral
-
IWM is sitting on the 200-week moving average. A break below it would be bearish.
Risk-Off
- All four key US Indices suffered significant losses for the week. The Dow lost 4.1%, the S&P 500 plummeted 4.8%, the Nasdaq fell 5.5%, and the Russell 2000 lost 4.5%.
- Real motion in all the indices is not oversold, suggesting there might be more downside.
- The technical conditions continued to deteriorate for all indexes on all timeframes, as they are below all key moving averages. The indexes are in confirmed bear phases.
- Relative to last week’s swing low, IWM is the strongest index.
- Every sector closed red on the week and were led down by sectors like semiconductors (SMH), which fell -6.0%, and transportation (IYT), which was down -8.41%. Risk-Off sectors were also down, but less so. Consumer staples (XLP) declined -3.6% and utilities (XLU) fell -3.7%.
- Volume patterns neutralized and were flat across the board.
- Market Internals look similar for both SPY and the Nasdaq Composite, with respect to the McClellan Oscillator, which flipped from over 50 (positive) to under 50 (bearish).
- The Nasdaq Advance-Decline Line is at new lows while the NYSE Advance-Decline Line is not as weak.
- In the NYSE, there is a possible divergence developing in the cumulative Advance-Decline Line relative to the prior week’s swing low. If the SPY takes out its recent swing high, this would be bullish.
- The number of both NYSE and Nasdaq new 52-week lows expanded to more than 300.
- The number of stocks under their 50- and 200-day moving averages increased relative to the prior week’s swing low. However, the number of stocks under their 10-week moving averages did not make a swing low. If the SPY closes over its 10-day moving average, this would be bullish.
- Real motion in the TLT has a potential divergence. The TLT made a new low relative to its June low, and real motion did not.
- The yield curve remains inverted, which is a recessionary indication.
- Value stocks outperformed growth stocks, but both are in a bear phase.
- The three strongest members of Mish’s Modern Family, according to our Triple Play indicator, are IWM, KRE, and IBB.
- DBA held up well and is still outperforming the S&P 500, suggesting sustained inflation.
- Gold (GLD) broke its 200-week moving average since 2018. This is very bearish. However, on daily chart it is oversold (under the Bollinger band in price and real motion). If it trades back over the Bollinger band, it could have a mean reversion rally.
- The US dollar closed up for the week and hit new highs again.
More By This Author:
What Is Moving The Markets? 10 Headwinds That Remain In PlacePotential Signs That Could Derail The Economy
Walking The Fine Line - 5 Indicators To Tell You When It Is Safe To Invest


Comments
Log in or sign up to join the conversation.