
Rising 10-Year Yield Puts Investors On Pause Despite Robust
Rather than living up to its history as one of the best months for stocks, April proved to be a disappointment this year despite robust year-over-year Q1 corporate earnings growth of roughly +20%. But there were some interesting developments nonetheless. In spite of investors’ apparent desire to start rotating away from the mega-cap Tech leaders and the Momentum factor into the neglected market opportunities, it is clear that some of the FAANG juggernauts still matter…and wield plenty of clouts. Witness the market’s reaction to Facebook (FB ), Amazon.com (AMZN ), and Apple (AAPL) earnings announcements as each dazzled beyond expectation. Nevertheless, I think the fledgling trend away from a narrow list of market leaders and into a broader group of high-growth market segments with more compelling forward valuations will soon resume. Likewise, while I still think full-year 2018 ultimately will see a double-digit total return on the market-cap-weighted S&P 500, with the index closing the year north of 3,000 on the back of historic earnings growth (even with some P/E compression), I also think a well-selected portfolio of attractive “growth at a reasonable price” (GARP) stocks has the potential to perform even better.
This is what we at Sabrient seek to do with our proprietary GARP model, including our monthly all-cap Baker’s Dozen portfolios as well as portfolios for small-cap growth, dividend income, defensive equity, and stocks that tend to thrive in a rising interest-rate environment. Another way to find clues about near-term opportunities in the market is to track the buying behavior of corporate insiders and the sell-side analysts who follow the companies closely, and for that, we employ our proprietary “insider sentiment” model. Also, I still like small caps to outperform this year, and indeed smalls have outperformed large caps over the first four months, with Energy, Healthcare, and Financial sectors showing the greatest relative outperformance among small caps.
As for the current market climate, after the big January market run-up had run its course following passage of the tax bill, investors have spent the ensuing few months struggling to assess the “new reality” of higher volatility, gradually rising rates, political posturing around global trade, and a rotation from the long-standing mega-cap Tech market leaders. Would asset classes indeed return to “normalcy,” in which equities rise comfortably along with interest rates, like they used to do back before central banks began “easy money” policies that jacked up indebtedness and asset correlations across the board? What is the new relationship between stocks and bonds (and interest rates)? Will there be a “Great Rotation” out of bonds and into stocks? A rotation out of bonds would drive up yields, and a rising risk-free rate for a hugely indebted world is a scary prospect for equities on a discounted cash flow basis. So, as the 10-year yield has hit the 3.0% level and mortgage rates have reached the highest levels since summer 2013, equity investors have hit the pause button. But I continue to contend that there is plenty of demand for both debt and equity securities such that Treasury Bonds will catch a bid at current levels, slowing the ascent of longer-term rates, while equities rise in line with robust corporate earnings growth, albeit with some compression in P/E multiples versus last year.
In this periodic update, I provide a market commentary, offer my technical analysis of the S&P 500, review Sabrient’s latest fundamentals-based SectorCast rankings of the ten US business sectors, and serve up some actionable ETF trading ideas. In summary, our sector rankings still look bullish, while the sector rotation model remains in a neutral posture during this period of consolidation and testing of support levels. Read on...
Market Commentary:
The period from 2009 through most of 2016 was characterized by a sole reliance on monetary stimulus (ZIRP and QE), which in my view used asset inflation to underpin the economy but failed to stimulate wage/price inflation or anything more than lethargic economic growth. Moreover, this broad asset inflation was also largely characterized by asset correlation in which both stocks and bonds appreciated as the “easy money” flowed into both (except during 2013). However, under “normal” economic conditions, interest rates are pushed up (and bond prices fall) during periods of economic strength as the Fed seeks to control inflation and prevent the economy from overheating, while equity prices rise. But investors today seem to fear that our heavily-indebted US and foreign economies aren’t prepared for such normalcy under the assumption that the resulting rise in interest expense (government, individual, and corporate) will overwhelm all else before wage and personal income growth even have a chance to get off the mat.
Even as some of the bigger worries regarding North Korea and trade wars have subsided, investors have remained defensive. And that behavior in and of itself has some analysts worried. For example, JP Morgan has just published an investor guide for getting defensive, as it thinks the market’s tepid response to robust earnings is foreshadowing problems ahead. The bank believes the economic growth cycle may end in 2019 while real rates collapse, so it says investors should underweight equities and increase their holdings of gold and long duration bonds.
But in my view, despite some investor trepidation, conditions could hardly be better for equities. As I have often stated, I still expect to see higher stock prices for the next few years (albeit with some P/E compression or “normalization”) as a stronger “boom cycle” kicks in – rather than the slow, plodding economic uptrend (supported only by monetary policy-induced asset inflation). Because we haven’t seen the usual “boom” part of the boom & bust cycle, it is likely to me that the “bust” stage has been postponed, as the expected “busts” manifested in a corporate profit recession and a lengthy capex recession, stagnant wages, and falling labor participation, which were masked by the Fed-driven asset inflation.
S&P 500 companies have been delivering earnings above estimates at a record pace, with nearly 80% of companies topping consensus estimates (the highest percentage since 1999). Year-over-year, Q1 EPS is up around +20%, spurred by things like 7% sales growth, corporate tax cuts, deregulation, elevated operating leverage, a relatively weak dollar, and higher oil prices. Energy stocks, in particular, are providing an outsized contribution to EPS growth as sustained production curbs from OPEC and Russia, strong global demand (especially in Asia), geopolitical developments in producing nations like Venezuela, Libya, and Iran, are all supporting crude prices, despite a surge in US oil production, which is now at all-time highs with infrastructure running at max capacity.
Furthermore, in addition to companies announcing strong earnings and forward guidance, as well as new capital investment, hiring, plant upgrades, onshoring of facilities, etc., it is also evident that M&A and share buyback programs are accelerating once again. The latest blockbuster announcements include Marathon Petroleum (MPC ) agreeing to buy Andeavor (ANDV) for $23 billion and T-Mobile’s (TMUS) takeover of Sprint (S) for $26 billion. As for buybacks, BAML predicts that S&P 500 companies should end up repurchasing $850 billion of company stock this year, which would be a huge 60% increase over 2017. Apple alone just announced an additional $100 billion in buybacks, on top of their existing $210 billion program for this year. The firm also announced a significant dividend boost. In addition, Morgan Stanley has estimated that about $400 billion in global dividends will be paid out this quarter. Although some will be used by investors as discretionary income, much of it will be reinvested, adding, even more, buying fuel to the equity market.
Many (including myself) have predicted that active selection would start to outperform passive indexing this year, as sector correlations remained low and investors picked their spots for investment based on fundamentals. But at the moment there are too many negative narratives flying around giving rise to unwelcome news-driven, risk-on/risk-off trading, leading to elevated correlations and volatility as well as reduced strategic equity exposures. Although immediate dangers regarding North Korea and trade wars are tempered for now while negotiations are underway, there are other near-term bogeymen to deal with domestically, such as another debt ceiling showdown in September and the mid-term elections in November. However, Dan Clifton of Strategas Research Partners reassures us that while the average midterm election year correction since 1962 is -18%, these corrections have been buying opportunities with an average 12-month post-election return of +31%. Moreover, he says the S&P 500 has not declined in the 12 months following a midterm election year since 1946. Nevertheless, the relentless rise of passive investing has resumed, at least for the moment.
To me, the primary risk to my positive outlook is global debt. The latest Global Debt Monitor report from the Institute of International Finance (IIF) stated that governments, businesses, and individuals added $21 trillion of total debt during 2017, driven by low interest rates, bringing the total outstanding debt around the world to a record $237 trillion at year-end, with a total debt to GDP ratio above 300% (although it is actually slightly lower than the record set in 3Q2016 due to such strong global GDP growth). China has a massive (and accelerating) debt load, with a total debt-to-GDP ratio officially around 300%, although some analysts have estimated it to be as high as 400% given shadow banking and the shady so-called “wealth management products.” A hard economic landing coupled with a massive currency devaluation would overwhelm the gradual reforms the Chinese government has begun to implement. And given this worrisome state of affairs, do we really think trade negotiations can effectively address China’s institutionalized intellectual property theft that has been so important to their amazing economic growth rate, no matter what President Xi has promised in his speeches?
Nevertheless, the International Monetary Fund (IMF) has estimated 3.9% worldwide economic growth both in 2018 and 2019. The IMF projects the US economy growing at 2.9% in 2018 and 2.7% in 2019 – in other words, continued gradual growth rather than a “boom” cycle. The US Bureau of Economic Analysis (BEA) published its final estimate of real GDP growth in 4Q17 at 2.9%, while its “advance” estimate for 1Q18 is 2.3%. The Atlanta Fed’s GDPNow model as of May 1 raised its 1Q18 GDP forecast to 4.1% (due to higher expected consumer spending and private fixed investment), while the New York Fed’s Nowcast model projects 3.0% for 1Q18 and 3.2% for 2Q18. These forecasts all look pretty good.
In addition, Mark Skousen’s “Gross Output” metric, or GO, is a much broader and arguably more accurate measure of the economy, and it is gaining adherents (including me). It seeks to reflect the full value of the supply chain (i.e., B2B spending that moves all goods and services toward the final retail market). Notably, GO as reported by the BEA rose 4.6% in the 4Q17 (compared to 2.9% for GDP), but Skousen says BEA may underestimate GO growth by not including all spending at the wholesale and retail trade level. When he includes those items, adjusted GO actually grew 5.6% in real terms, with B2B spending increasing a real 9%. Skousen believes in the classical economic theory of Say’s Law of Markets, which takes a supply-side view that business spending is the key indicator to monitor, while consumer spending is largely the effect, not the cause, of prosperity – in other words, you have to have something of value to sell before you have the means to buy (i.e., supply creates demand). Similarly, noted supply-sider Larry Kudlow has said, “When businesses produce profitably, they create income-producing jobs and thus consumers spend."
On this topic, the Dallas Fed Manufacturing Survey reported that the Production Index soared by 11 points to 25.3, while Capacity Utilization climbed 8 points to 18.7, Shipments rose 9 points to 19.3, and New Orders and Growth Rate of Orders reached their highest readings of the year. Meanwhile, April consumer confidence hit 128.7, which is still very near its all-time high of 130 achieved in February. Keep in mind, as well, that business activities dominate the 10 Leading Economic Indicators, which have been scoring quite well lately.
After the quarter-point rate hike in March, the current target fed funds rate is 1.50-1.75%. As expected the Fed didn’t raise at its May meeting on Wednesday. CME fed funds futures currently place the odds of rate hike #2 coming at the June meeting at 95%, and by September there is a 75% chance of a third rate hike and an 8% chance of a fourth hike. By the December meeting, there is an 88% chance of a third hike, a 45% probability of a fourth quarter-point rate hike, and even a small 7% chance of a fifth hike, while the odds are only 12% that the fed funds rate remains at 1.75%-2.00% (i.e., only two rate hikes this year). The 10-year Treasury continues to catch a bid around the 3.0% level. It closed Wednesday at 2.96%, while the 2-year closed at 2.49%. The closely-watched 2-10 spread sits at 53 bps, remaining stable but well under the 100 bps “normalcy threshold.”
Notably, the 10-year Treasury suddenly surged mid-April from around 2.8% to 3.0% as CPI, oil prices, wages, salaries, and benefits have all trended higher. It remains to be seen how this will impact the Fed’s current strategy for rate hikes, if at all. In any case, I remain doubtful of a continued selloff in Treasuries leading to a sustained breakout in yield much above 3.0% in the 10-year. Here’s why:
1. Similar risk-free sovereign debt alternatives are yielding so much less, such as Germany at 0.56% and Japan at only 0.04%.
2. The dollar has found its footing (back in the positive YTD), which should help quell commodity inflation and ease worries among foreign carry-trade investors about currency risk.
3. Aging demographics create increasing passive capital inflows to fixed income funds, such as from strategic asset allocations for retiring Baby Boomers.
4. New issuance of Treasuries has a natural buyer in the form of fixed-income portfolio managers and ETFs whose mandate is to track bond indexes. Such indexes are typically cap-weighted, meaning the securities in the index are weighted according to the market size of each bond type, so, as Treasuries flood, the market, their weighting in the indexes increases, and the funds that track those indexes must buy them in higher proportions. Indeed, SSGA SPDRs research reported strong ETF flows into fixed income during April, with long-dated bonds getting the most inflows during the last week of April after the 10-year hit 3.0%.
5. Given high global debt levels and a rate-sensitive mortgage market that is so important to our economy, a spike in interest rates would be detrimental, so the Fed surely will take great pains not to let that happen.
Also worth mentioning, First Trust’s Brian Wesbury has opined that the yield curve likely will not invert (an occurrence that would foreshadow a recession) unless the Fed pushes the funds rate (currently 1.50-1.75%) above the nominal GDP growth rate.
By the way, the CBOE Market Volatility Index (VIX), aka “fear gauge,” closed Wednesday at 15.97. Although elevated compared with last year’s persistently low readings, volatility actually has returned to normalcy. Since the turn of the century 18 years ago, the VIX has generally fluctuated in the 15-25 range (with average daily close of 20), rather than the 10-15 range of 2017 (with average daily close of 11).
Let me wrap up my commentary with this: Unlike the past several years that were characterized by asset correlation (with strength in both stocks and bonds) due to the Fed-induced asset inflation (from ZIRP and QE), today’s strong underlying economic conditions and robust earnings growth are being met with a return to the historically familiar situation in which the Fed raises rates to control inflationary pressures and prevent overheated growth; it’s only the huge global indebtedness that makes it seem scary this time. While nothing is certain, in this “normal” climate characterized by strong growth and rising rates, we at Sabrient expect our Baker’s Dozen portfolios to outperform, so long as investors are inclined to select investments based on fundamentals rather than react to headline risk.
Furthermore, our Rising Rate portfolio might be another option to consider. Which sectors do we emphasize in the Rising Rate portfolio? Well, keep in mind that we don’t make a top-down decision on which sector to overweight; instead, our GARP model will give us more choices within the sectors that are scoring the best, and we simply enforce sector concentration limits to ensure we are not overly exposed to a given sector. Economically-sensitive sectors like Industrials and Financials tend to score well in today’s market, as well as sectors that benefit from commodity inflation like Materials and Energy. Also, Technology is typically favored as an all-weather sector given its lower financial leverage (i.e., lower debt-to-equity ratio) and its synergies throughout the broad economy as a driver of productivity.
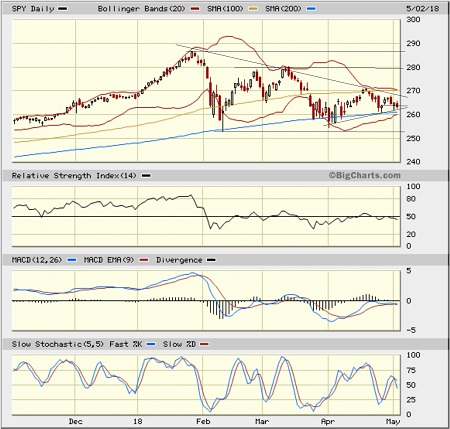
SPY Chart Review:
The SPDR S&P 500 ETF (SPY) closed Wednesday, May 2 at 263.20. It has been a lengthy consolidation pattern, with the 200-day simple moving average (SMA) providing reliable support. The mid-April rally filled the minor gap at 270 but then turned tail to retest the 200-day SMA. It now seems to be forming either a new descending wedge or a descending triangle pattern, with lower highs. A confirmed breakdown below the 200-day SMA would be undesirable, but a confirmed breakdown below double-bottom support at 253 would be quite bearish and suggest the start of a larger selloff. However, keep in mind that descending triangles sometimes turn out to be quite bullish, fueled by both dip buying and short covering. A confirmed breakout above the upper downtrend line would be quite bullish, perhaps going up to 280 – or even test the January highs near 288. Bollinger Bands are pinching together, while oscillators RSI, MACD, and Slow Stochastic all are coiling in neutral territory – all in preparation for the next big move. I still believe the upside is the more likely direction, given the strong fundamentals and absence of any imminent major risks.
Latest Sector Rankings:
Relative sector rankings are based on our proprietary SectorCast model, which builds a composite profile of each of over 600 equity ETFs based on bottom-up aggregate scoring of the constituent stocks. The Outlook Score employs a forward-looking, fundamentals-based multifactor algorithm considering forward valuation, historical and projected earnings growth, the dynamics of Wall Street analysts’ consensus earnings estimates and recent revisions (up or down), quality and sustainability of reported earnings, and various return ratios. It helps us predict relative performance over the next 1-3 months.
In addition, SectorCast computes a Bull Score and Bear Score for each ETF based on recent price behavior of the constituent stocks on, particularly strong and weak market days. A high Bull score indicates that stocks within the ETF recently have tended toward relative outperformance when the market is strong, while a high Bear score indicates that stocks within the ETF have tended to hold up relatively well (i.e., safe havens) when the market is weak.
Outlook score is forward-looking while Bull and Bear are backward-looking. As a group, these three scores can be helpful for positioning a portfolio for a given set of anticipated market conditions. Of course, each ETF holds a unique portfolio of stocks and position weights, so the sectors represented will score differently depending upon which set of ETFs is used. We use the iShares that represent the ten major U.S. business sectors: Financial (IYF), Technology (IYW), Industrial (IYJ), Healthcare (IYH), Consumer Goods (IYK), Consumer Services (IYC), Energy (IYE), Basic Materials (IYM), Telecommunications (IYZ), and Utilities (IDU). Whereas the Select Sector SPDRs only contain stocks from the S&P 500 large-cap index, I prefer the iShares for their larger universe and broader diversity.
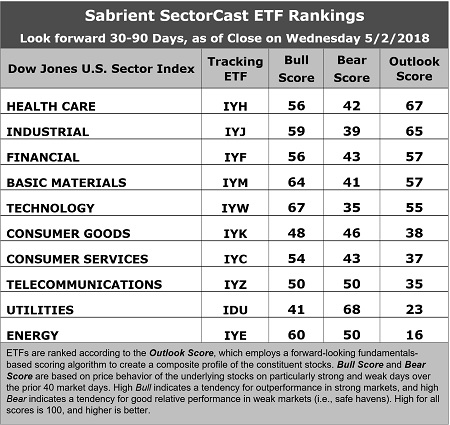
Here are some of my observations on this week’s scores:
1. The rankings have shuffled quite a bit since last month, but still look bullish overall, although the top scores are lower than usual, creating a narrow-range bunching among the top five. Healthcare has suddenly emerged at the top with an Outlook score of 67, followed by Industrial at 65. Healthcare has seen solid sell-side analyst sentiment recently (net positive revisions to EPS estimates), a low forward P/E (15.5x), and good insider sentiment (net open market buying). Industrial boasts the best recent sell-side analyst sentiment, a good projected year-over-year EPS growth rate (14.2%), a forward PEG (ratio of forward P/E to forward EPS growth rate) of 1.2, good insider sentiment, and strong return ratios. Financial and Basic Materials tie for third at 57, followed by Technology at 55.
2. Energy continues to sit at the bottom of the Outlook rankings with a score of 16 despite its strong projected year-over-year EPS growth rate of 42.1% and by far the lowest forward PEG of 0.45. Energy remains saddled with the highest forward P/E (19.1%) and low return ratios. Utilities is also in the bottom two with a score of 23, mainly due to its low forward growth rate (4.9%), which leads to by far the highest forward PEG of 3.5.
3. For comparison, the S&P 500 displays a forward P/E of 16.3x and a forward PEG around 1.1, which has plummeted from around 1.5 at the start of the year as earnings estimates have surged while share prices have struggled. iShares sector ETFs displaying the lowest forward PEGs include Energy at 0.45, Consumer Services (Discretionary/Cyclical) at 1.05, and Financial at 1.07.
4. Looking at the Bull scores, Technology enjoys the top score of 67, followed by Materials, as stocks within these sectors have displayed relative strength on strong market days, while Utilities scores the lowest at 41. The top-bottom spread is 26 points, which reflects low sector correlations on strong market days. It is desirable in a healthy market to see low correlations reflected in a top-bottom spread of at least 20 points, which indicates that investors have clear preferences in the market segments and stocks they want to hold (rather than broad risk-on behavior).
5. Looking at the Bear scores, we find Utilities at the top with a score of 68, which means that stocks within this defensive sector have been the preferred safe havens lately on weak market days. Technology has the lowest score of 35, as investors have fled during recent market weakness. The top-bottom spread is 33 points, which reflects quite low sector correlations on weak market days. Ideally, certain sectors will hold up relatively well while others are selling off (rather than broad risk-off behavior), so it is desirable in a healthy market to see low correlations reflected in a top-bottom spread of at least 20 points.
6. Healthcare displays the best all-around combination of Outlook/Bull/Bear scores, followed closely by Materials, while Energy is the worst. Looking at just the Bull/Bear combination, Energy is the best, indicating superior relative performance (on average) in extreme market conditions (whether bullish or bearish), while Consumer Goods (Staples/Noncyclical) scores the worst, as investors have generally avoided the sector lately.
7. This week’s fundamentals-based Outlook rankings continue to reflect a bullish bias, given that the top five sectors are economically-sensitive or all-weather, and all five score above 50. Keep in mind, the Outlook Rank does not include timing, momentum, or relative strength factors, but rather reflects the consensus fundamental expectations at a given point in time for individual stocks, aggregated by sector.
ETF Trading Ideas:
Our Sector Rotation model, which appropriately weights Outlook, Bull, and Bear scores in accordance with the overall market’s prevailing trend (bullish, neutral, or defensive), displays a neutral bias and suggests holding Healthcare (IYH), Industrial (IYJ), and Financial (IYF), in that order. (Note: In this model, we consider the bias to be neutral from a rules-based trend-following standpoint when SPY is between its 50-day and 200-day simple moving averages.)
Besides iShares’ IYH, IYJ, and IYF, other highly-ranked ETFs in our SectorCast model (which scores nearly 650 US-listed equity ETFs) from the Healthcare, Industrial, and Financial sectors include PowerShares Dynamic Pharmaceuticals (PJP), PowerShares Dynamic Building & Construction (PKB), and PowerShares KBW Bank Portfolio (KBWB).
If you prefer a bullish bias, the Sector Rotation model suggests holding Technology, Basic Materials, and Industrial, in that order. On the other hand, if you are more comfortable with a defensive stance on the market, the model suggests holding Utilities, Telecom, and Healthcare, in that order.
An assortment of other interesting ETFs that are scoring well in our latest rankings include First Trust Value Line 100 (FVL), iShares PHLX Semiconductor (SOXX), SPDR MFS Systematic Value Equity (SYV), Elkhorn Lunt Low Vol/High Beta Tactical (LVHB), VictoryShares US Small Cap Volatility-Wtd (CSA), VanEck Vectors Steel (SLX), Alpha Architect US Quantitative Value (QVAL).
Disclaimer: This newsletter is published solely for informational purposes and is not to be construed as advice or a recommendation to specific individuals. Individuals should take into account ...
more

