
REITs: Slightly Better Than Broad U.S. Market, But Still Not Cheap
When I wrote an article on REITs for the Wall Street Journal in early 2017, I used a research report from Research Affiliates in Newport Beach, CA to argue that the asset class was overpriced and poised to deliver 0%-2% or so real returns for the next decade.
My article sparked a lot of mail and controversy. One reader reply underneath my article on the WSJ website said “Among equity REITs traded on stock exchanges there has literally never been a 10-year period in the history of REIT investing when real total returns averaged 0% per year (or worse) as [John Coumarianos’s] approach predicts.”
Another letter, which the Journal published as a reply to my article, from Brad Case of the National Association of Real Estate Investment Trusts (NAREIT) strangely had the exact same language about REITs never producing such a poor 10-year return as the letter written by someone of another name under the column on the website. Case’s formal, published letter went on to say, “The current REIT stock price discount to net asset value suggests that returns over the next 10 years may exceed inflation by around 8.15 percentage points per year on average.”
The decade isn’t up, but now, two years in, let’s see how things are going for REITs. Also, what’s the forecast today? Have things improved? After we assess recent returns, let’s go through the forecast again to see if things look any better now.
Not A Great Two Years For REITs
In 2017, two major REIT index funds – the Vanguard REIT Index fund and the iShares Cohen & Steers REIT Index ETF — produced a nearly 5% return each. Considering that the CPI (consumer price index) was up 2.1% in 2017, that’s about a 3% real or inflation-adjusted return.
In 2018, the iShares fund delivered a 5.29% return through October, while the Vanguard fund delivered a 2.03% return through October. So far inflation is running at an estimated 2.2% for the year, according to the Minneapolis Fed. That means REIT real returns for 2018 are in the 0%-3% range, depending on which index you use. For both 2017 and 2018, we are a far cry from Case’s 8.15% real return forecast.
Start With Dividend Yield
The analysis advocated by Research Affiliates was simple. First, start with “net operating income” (NOI) or rent minus basic expenses. NOI a good indication of the cash flow a property or a collection of properties are delivering. Investors take this number and divide by the price of a property to determine what they call a “capitalization rate.” In effect, that resembles an earnings yield (earnings divided by price) of a stock. Mutual fund investors can substitute dividend yield of a REIT-dedicated fund.
For my original article, the dividend yield of most REIT index funds and ETFs was around 4%. Now it’s closer to 3%. The iShares Cohen & Steers REIT ETF yields less than 3.2% right now, while the Vanguard REIT Index fund lists a current effective yield of 3.23% and a yield adjusted for return of capital and capital gain distributions over the past two years at 2.13%.
Upkeep
The second component of a return forecast is a property upkeep component. Real estate requires capital – not only for the initial purchase but also for maintaining the property. Things are always breaking and obsolescence always threatens landlords who must update kitchens, bathrooms, and other aspects of their properties. It’s true that with some property types, tenants are responsible for some upkeep and improvement, but that isn’t always the case. Research Affiliates figures 2% of the cost of the property per year, is a decent round number to use in a return forecast. Unfortunately, that wipes out most of the 3% dividend yield investors are currently pocketing.
So far, we are running at a 0 or 1% real annualized return for the next decade.
Price Change
The last component of real estate valuation and return forecasting is the most speculative. Where will properties trade in a decade? Nobody knows for sure, but Research Affiliates estimated in early 2017 that commercial property was priced 20% above its long term trend. If prices remained at that level, investors would capture the 4% yield minus the 2% annual upkeep or 2% overall. If prices reverted to trend, investors would have to subtract enough from net operating income adjusted for upkeep to bring future returns down to 1.4%.
Currently, on the Research Affiliates website, the firm forecasts REITs to deliver a 2% annualized real return for the next decade. That’s about where the forecast stood at the beginning of 2017. It’s worth noting that although that’s a low return, it’s actually a better forecast than the firm has for U.S. stocks, which it thinks won’t deliver any return over inflation for the next decade.
Gut Check
It’s often useful to take multiple stabs at valuation. So, in the spirit of providing a gut check, I supplemented this dividend-upkeep-price analysis with a simple Price/FFO (funds from operations) analysis. REITs have large, unrealistic depreciation charges, rendering net income a mostly useless metric. FFO, which adjusts net income for property sales and depreciation is a more accurate cash flow metric. FFO isn’t perfect either because it doesn’t account for different debt loads of different companies and because it doesn’t account for maintenance costs, but it’s a uniform metric that almost all REITs publish.
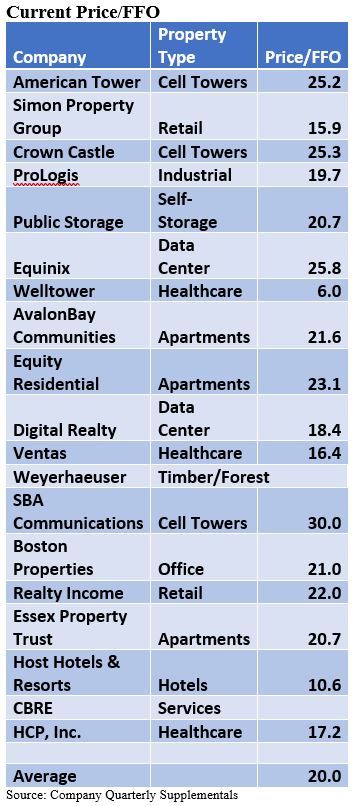
Of the top-20 holdings of the Vanguard Real Estate Index fund VGSIX, Weyerhaeuser and CBRE didn’t publish FFO metrics. The average of the other 18 companies was 20. That’s a pretty high multiple for REITs, which are slow growth stocks.


