
Record Highs Reached By The S&P 500 In Week 2 Of October 2017
Following the records set in the first week of October 2017, the S&P 500 (Index: SPX) continued to mark new highs during the second week of the month.
More specifically, the 2555.24 that marked the level of the S&P 500 at the close of trading on Wednesday, 11 October 2017 upped the ante for the index's series of new high closing values, although it wasn't much of a gain over the previous week's closing value of 2549.33 on Friday, 6 October 2017. Nor was it far below the S&P 500's all-time intraday high of 2557.56 that the index reached at 10:46 AM EDT a week later on Friday, 13 October 2017, before slipping back to end the week at 2553.17.
(Click on image to enlarge)
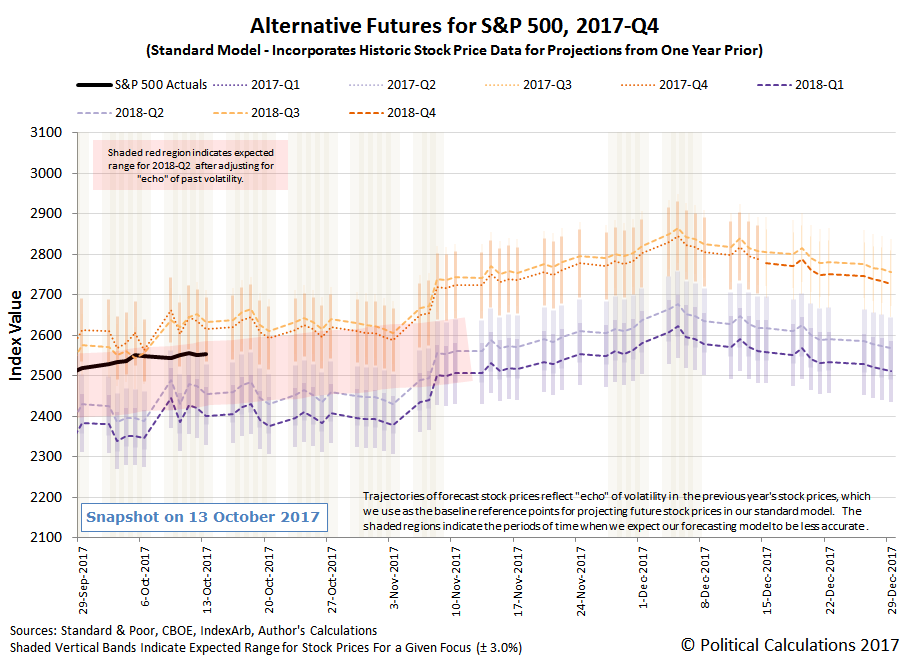
The S&P 500 continues to track along near the upper end of the echo effect-adjusted range that we first forecast back in the first week of September 2017. At that time, we observed that investors were largely focusing on 2018-Q2 as they considered the future for the S&P 500, where we constructed our forecast based on the assumption that they would largely continue focusing on that distant future quarter over the next two months.
As things stand today, we're now past the halfway point, with just three and a half weeks to go before we reach the end of our need to account for the echo of past volatility in stock prices in our dividend futures-based model of how stock prices work.
Through Week 2 of October 2017, there was nothing to really prompt investors to shift their focus toward a different point of time in the future, which can be seen in the headlines that we flagged during the week.
Monday, 9 October 2017
- Oil prices climb after OPEC signals possible deal extension
- Wall Street recedes from highs as quarterly reports loom
Tuesday, 10 October 2017
- Oil rises on tighter market, but doubts swirl on sustainability
- Fed's Kaplan says low 10-year yield an 'ominous' sign
- Wal-Mart rally pushes Dow to all-time high
Wednesday, 11 October 2017
- Fed's Kaplan says low 10-year yield an 'ominous' sign
- Fed divide on inflation intensified at September policy meeting
- New York Fed's market chief confident on balance sheet reduction plan
- Wall Street ticks higher to record close; eyes on earnings, Fed
Thursday, 12 October 2017
- Oil slips despite larger draw in U.S. stocks
- Fed 'should defend' inflation target or risk losing credibility: Bullard
- Fed's Brainard sees merits to allowing higher inflation after future recessions
- Wall Street slips as banks fall after results, AT&T sinks
Friday, 13 October 2017
- Oil rallies nearly 2 percent on China import boost, U.S.-Iran tensions
- As Fed debates cause of low inflation, should be patient, Kaplan says
- Wall St. ends up after economic data; S&P up for a fifth week
Elsewhere, Barry Ritholtz broke the second week of October 2017 down into its economic and market pluses and minuses.
And that's the week that was! As for the week ahead, unless investors shift more of their focus toward other points of time in the future than they are already, look for the S&P 500 to continue falling within the range shaded in red in this week's spaghetti chart update.
Disclosure: None.

Comments
 No Thumbs up yet!

