Recession Fears Are Creating A Buying Opportunity In The S&P 500
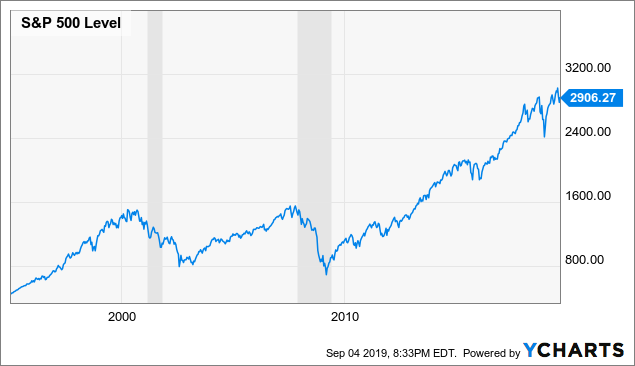
Investors are getting increasingly concerned about the possibility of a recession and a bear market in the coming months. Needless to say, the S&P 500 can suffer big losses during recessions, and the last two recessions - shaded areas in the chart - produced massive drawdowns in the S&P 500.
Data by YCharts
On the other hand, the statistical evidence shows that the S&P 500 generally delivers attractive returns in times of economic pessimism, as long as the economy does not go into a deep recession. Looking at both sentiment and the economic data from a broad perspective, chances are that the current environment could be providing a good entry point in the S&P 500 over the midterm.
Fear Creates Opportunity
The ISM index declined to levels below 50 this week, which signals a contraction in manufacturing activity in the United States. Stocks sold off strongly after the news was released on Tuesday, and it makes sense to assume that a contraction in manufacturing activity is bad news for the S&P 500 over the middle term.
However, that is not the case. Looking at the historical evidence, the S&P 500 index tends to deliver solid returns more often than not after the ISM index falls below contraction levels for the first time in years.
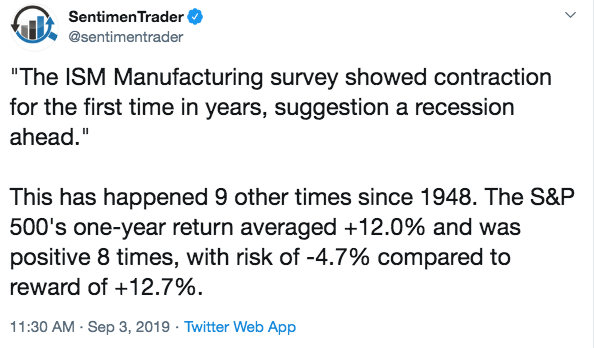
SentimentTrader analyzed the evidence, and they reached a very interesting conclusion. Most of the time, when the ISM Manufacturing survey goes into contraction after being in expansion for several years, this creates a buying opportunity for investors as opposed to a reason to sell stocks.
Source: SentimentTrader
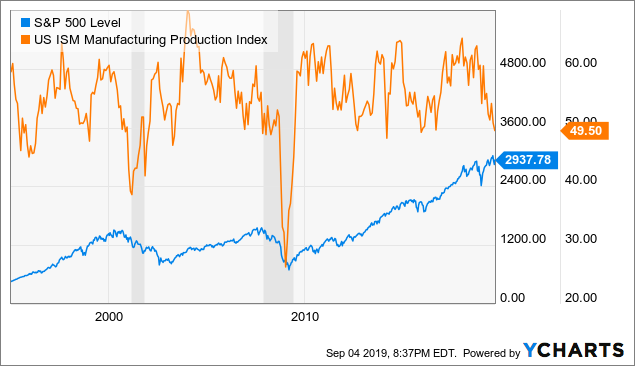
The chart shows the S&P 500 index and the ISM Manufacturing Production Index since the year 2000. The big notable exception happened when the ISM crossed below 50 in February of 2008, and the S&P 500 was down by a massive 47% one year later. However, more recent signals in 2012 and 2015 were buying opportunities in stocks, with the S&P 500 rising by 19% and 12% in the following year.
Data by YCharts
The huge decline in 2008 cannot be overlooked, but the evidence is still quite clear. In 8 out of 9 historical occasions, this signal was actually bullish for stocks, and the average return for the stock market was quite healthy after the ISM index showed contraction for the first time in years.
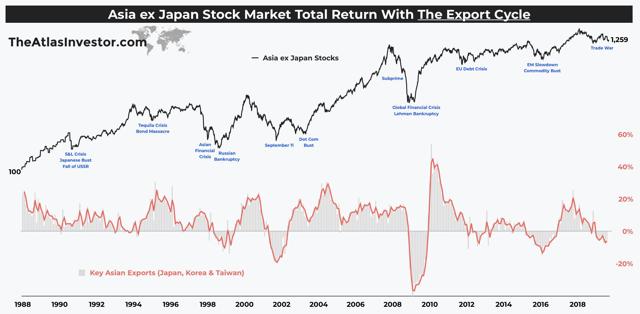
The same dynamic is at play in international markets, and this is particularly relevant now that exports in Asia are under heavy pressure due to the trade war uncertainty. Exports are a crucial growth engine for Asian economies, so you may think that a slowdown in exports is a reason to sell Asian stocks. That would be a wrong assessment, however.
The chart from The Atlas Investor shows how Asian stocks have evolved in comparison to key Asian exports. When you see a massive contraction in exports such as in 2008, stock prices can suffer deep pullbacks.
However, export contractions in periods such as 2012 and 2016, as well as in many other periods before the financial, the crisis turned out to be buying opportunities in Asian stocks.
Source: The Atlas Investor
Betting On The Unexpected
The data above can seem counter-intuitive to many investors. How can it be that stocks all over the world generally tend to deliver superior returns after the economic data shows weakness?
The main point to consider is that market returns do not reflect the economic fundamentals in isolation, but rather the economic fundamentals in comparison to expectations. The stock market is a forward-looking mechanism, and the main factor is whether the data is better or worse than previously expected.
When the economic data shows signs of weakness, this is rapidly reflected on investors' expectations. Many times the media magnifies the psychological impact of negative economic news, so the market tends to overstate the significance of those negative data points.
Manufacturing and exports are very important areas of the economy, but modern-day economies are enormously complex, diversified, and sophisticated, so focusing on a small group of specific data points does not paint the whole picture.
Most investors tend to get too pessimistic after the data shows signs of weakness. A low bar is relatively easy to beat, so low expectations set the stage for better than expected economic data and rising stock prices going forward.
This does not work all the time, sometimes things keep getting worse than previously expected, even after expectations have already reached pessimistic levels. This is the kind of scenario faced by investors in the 2008 crisis, for example. However, those kinds of massive crisis are rather rare, and they don't happen very often.
In simple terms, you can't sell stocks simply because the economic data is showing signs of weakness. As opposed to that, you need to consider what may happen in the future in terms of economic data versus current expectations. If those expectations are currently depressed, this tends to create buying opportunities more often than not.
In the words of George Soros:
Markets are constantly in a state of uncertainty and flux and money is made by discounting the obvious and betting on the unexpected.
The Current Market Environment
There is plenty of negativity in the market right now. The chart shows the S&P 500 index and the inverted put-call ratio bellow. It's easy to see that sentiment is rather negative, and these levels of negativity have been good entry prices in the stock market over recent years.
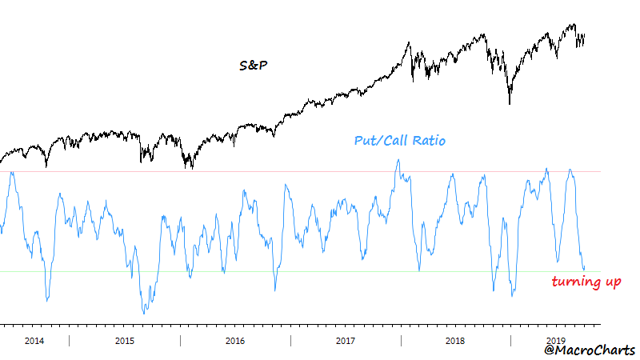
Source: MacroCharts
The chart from Yardeni shows the Citigroup Economic Surprise Index - which measures economic data versus expectations - versus the price to earnings ratio for the S&P 500.
There are two key observations to consider. To begin with, the economic surprise index is mean-reverting. When the data comes below expectations for several weeks, analysts start reducing their forward-looking expectations.
At some point, those expectations get too depressed, so the data starts outperforming expectations and vice-versa. There are several periods of sustained positive and negative surprises, but the index tends to revert to the mean over time.
In addition to this, there is a direct relationship between the valuation levels for the S&P 500 and the Economic Surprise Index. When the economic data is coming in better than expected, investors are more willing to pay higher prices for each dollar of current earnings.
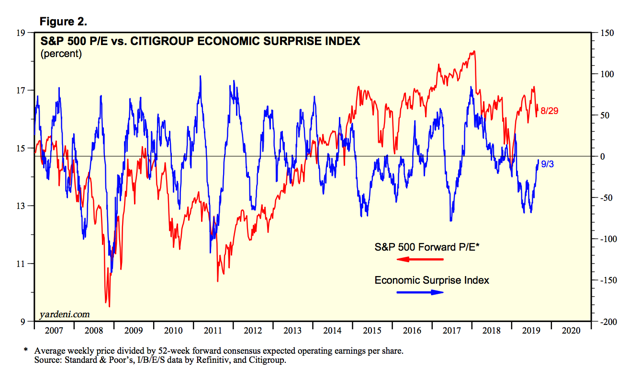
Source: Yardeni Research
It's important to note that the Citigroup Economic Surprise Index is actually rebounding higher recently. The negative news in areas such as manufacturing and exports are capturing most of the attention, but the broad economy is actually not as weak as those headlines would make you think.
The Bottom Line
The future is always a matter of probabilities as opposed to certainties. If we get a big recession such as the one in 2008, then the S&P 500 would be very vulnerable to the downside, even if there is considerable pessimism already incorporated into expectations. However, that does not seem to be the case according to the data currently available, since the broad economic data is actually coming in above expectations recently.
History shows that times of economic pessimism are generally buying opportunities for investors as long as the economy remains reasonably healthy. With this in mind, it makes sense to consider that current economic weakness could be setting the stage for attractive returns in the S&P 500 over the middle term.
Statistical research has proven that stocks and ETFs showing certain quantitative attributes tend to outperform the market over the long term. A subscription to The Data Driven Investor provides you access to profitable screeners and live portfolios based on these effective and time-proven return drivers. Forget about opinions and speculation, investing decisions based on cold hard quantitative data can provide you superior returns with lower risk. Click here to get your free trial now.

Disclaimer: I wrote this article myself, and it expresses my own opinions. I am not receiving compensation for it. I have no business relationship with any company whose stock is mentioned in ...
more


Buy high now??...Sell lower later??? That must that?? Right??