
Raging Rotation And A Key Reversal
Friday’s price action capped off a string of days that told a story of broadening market strength and expectations of improving economic conditions.
On a daily basis, the story sounds like this…
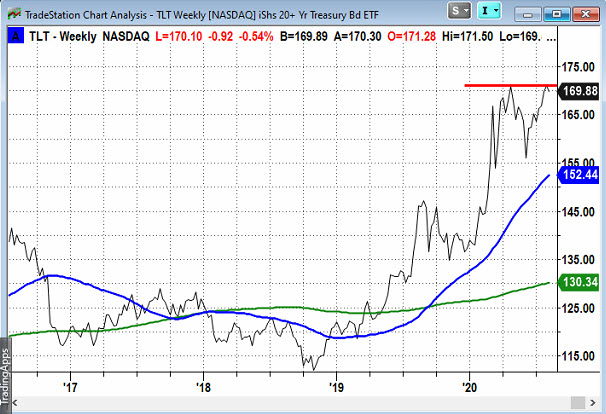
On Thursday, TLT (TLT) quickly retreated after breaching its April swing highs and continued its weakness into Friday, closing below its 10-DMA by the most significant margin in a month.
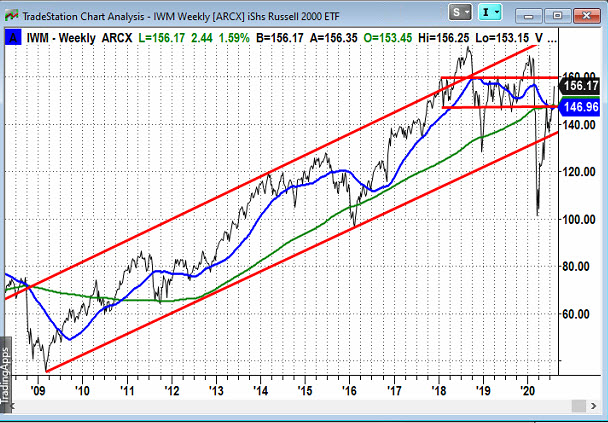
While the QQQ (QQQ) sold off on Friday, the small-caps, Grandpa Russell (IWM) accelerated higher after breaking an important swing high.
The same can be said for the transports (IYT), and retail (XRT).
Friday’s strength also pushed the banks (both XLF and XRT) out of multi-week ranges.
With banks, retail, and transports all rallying, the SPY was able to hold up, and the S&P equally weighted EFT (RSP) had an impressively strong day. (SPY)
The story gets more interesting when you look at the action in the areas that have been leading (i.e. SMH, IBB,GLD, etc).
And even more noteworthy when you take note of the longer-term chart pattern of all of these markets.
While the weaker parts of the market came alive, the hot areas didn’t get dumped. This is constructive.
For example…
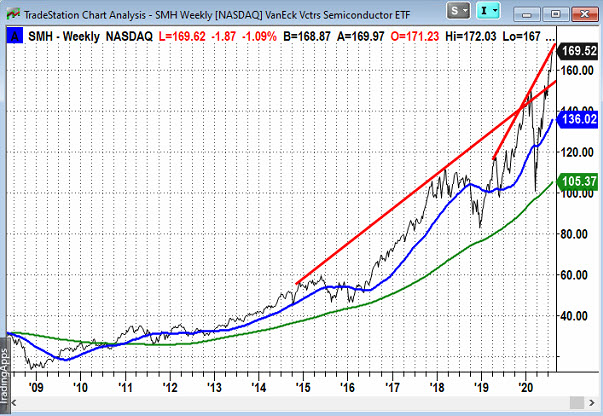
SMH was down on Friday, but it’s sitting on its 10-DMA.
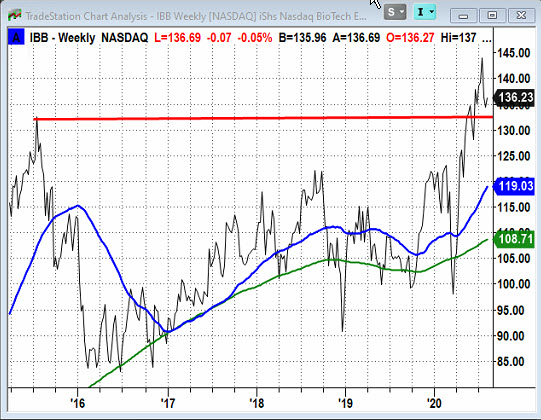
Biotech has been pulling back in an orderly way, and it’s sitting on major support and its 50-DMA.
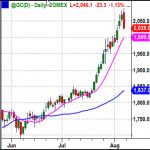
Gold is so hot that even a significant pullback would be nothing less than healthy. That said, there are patterns that suggest we should expect a pullback if it trades below Friday’s low.
For example, candlestick readers will see the doji top; futures traders will see the continuous contract has a key reversal pattern. This is the chart that is the featured image for this article. Additionally, as I like to point out… It closed under it its previous day’s low for the first time since the recent two week run began.
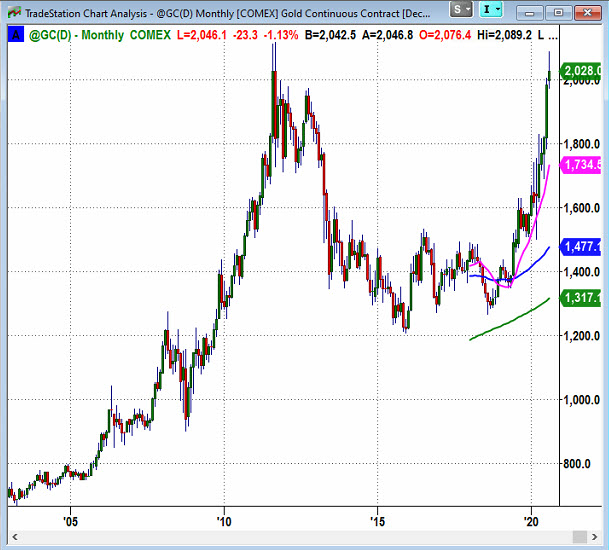
Since we’re on the topic of Gold, let’s start with the monthly chart of the futures. If you’re watching GLD, you’ll see GLD trading over its 2011 high. However, the futures shown below is not the case.
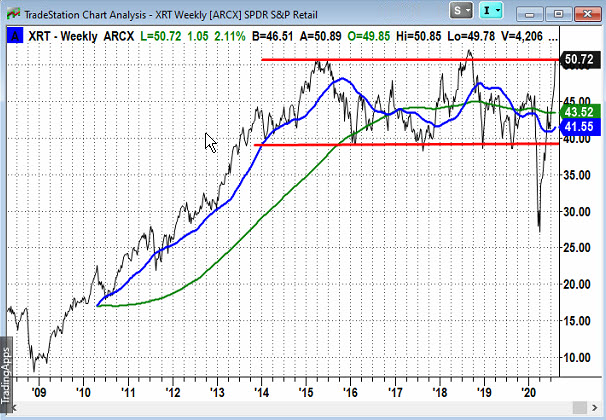
Retail (XRT) closed at levels not seen since late 2018, but there’s big resistance ahead.
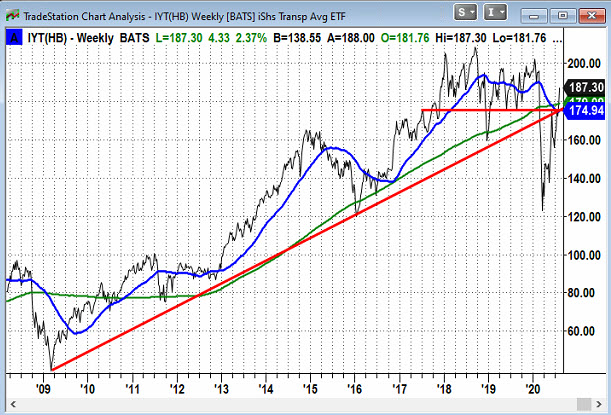
IYT traded back over the key resistance area of 175-180, its 200-week average, and the trend line from the 2009 lows.
IWM is back over its 200-week average and a pivotal area of 145.
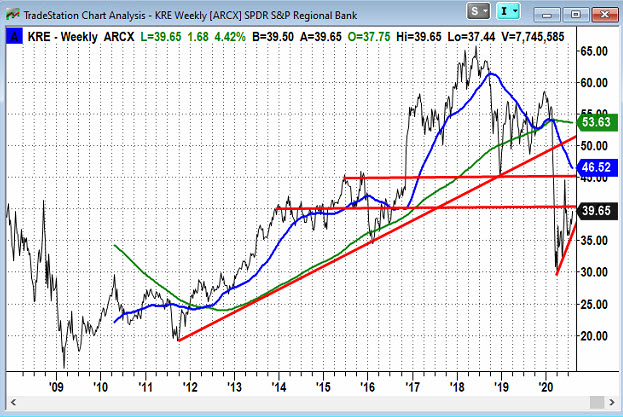
Regional banks, (KRE), is the laggard, and $40 has been a challenging area, but let’s see if its daily breakout can push it through $40 so it can test the even bigger area of $45. On the other hand, a break lower would look scary.
Perhaps this view of TLT will support a bullish tone for KRE as higher rates (lower TLT) could support a rally in KRE. It’s too soon to call a top in TLT, but a pause?
It’s way to early to call a top in SMH, but a rotational pause and healthy correction certainly would make sense based on this chart.
Finally, Biotech (IBB) was pushed over its all-time high that was previously set in 2015. Now it’s retraced back to that level, and as mentioned above, it also sits on its 50-DMA. This is a very pivotal level that could break big either way.
It’s shaping up to be a hot August!
S&P 500 (SPY) 339.08 all-time high, 330 important support
Russell 2000 (IWM) Strong move up, 157-159 resistance area. 151.78 key support
Dow (DIA) 276.38 swing high, 270 now pivotal support
Nasdaq (QQQ) 269 area pivotal support New all-time highs
TLT (iShares 20+ Year Treasuries) 170 area is pivotal. Tested April’s swings high on Thursday and Friday closed under the 10-DMA for the first time in a meaningful way in a month. Further weakness may continue.
Disclosure: None.

Comments
 No Thumbs up yet!

