
Price-Momentum Implied Forecasts: Bonds
Yesterday we reviewed the outlook for stocks based on a momentum profile from the vantage of the major asset classes, according to a set of proxy ETFs. Today’s focus turns to bonds around the world, using prices as of Dec. 27. Once again, the analytical lens is a two-part toolkit: 50- and 200-day moving averages, supplemented with a trailing one-year (252 trading days). The goal: develop some intuition about the near-term outlook for various slices of the global markets. Since the agenda is analyzing price trends, we’ll strip out distributions and look at price-only data, using charting resources via StockCharts.com.
As a preview, the main takeaway is that a bearish pall hangs over fixed income. The recent jump in interest rates has taken a toll, with one exception: junk bonds in the US. Why has junk managed to remain in the black when the rest of the field has suffered? One theory is that the higher yields of late reflect new expectations of stronger growth in the wake of Donald Trump’s election. While that’s generally a negative for investment-grade bonds, junk often trades as an equity proxy and so the higher prices in this corner of fixed income are tracking the rebound in US stock prices.
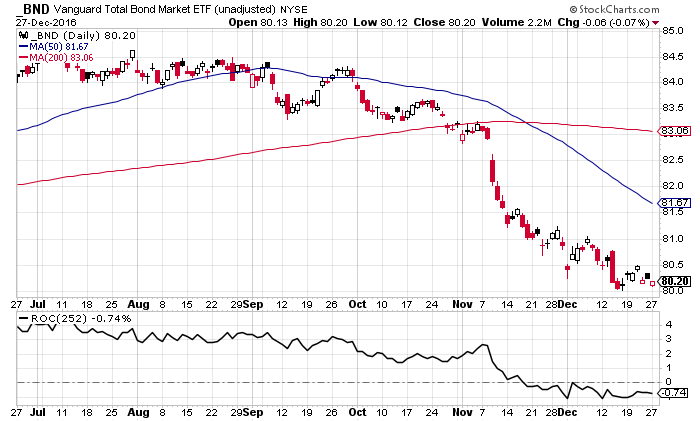
Let’s take a closer look, starting with US bonds other than junk. A bearish cloud weighs on a broadly defined measure of fixed income that’s primarily defined by Treasuries and investment-grade corporates. Vanguard Total Bond Market (BND) has tumbled since early November, and a negative skew for the moving averages and one-year return suggest that a rebound is nowhere in sight.
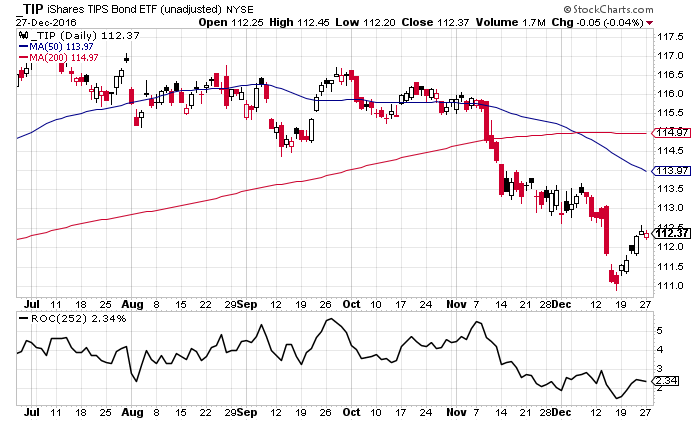
Inflation-indexed Treasuries don’t look much better, although iShares TIPS Bond (TIP) are still sitting on a modest one-year gain in price-only terms.
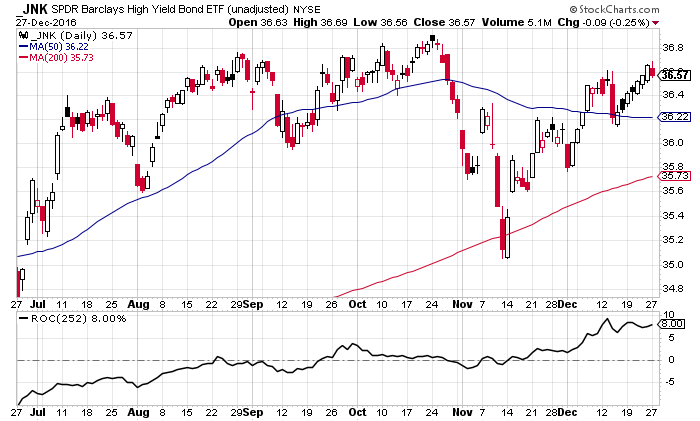
US junk bonds, by contrast, continue to trend higher. For the moment, the recent rise in interest rates hasn’t been a problem for below-investment-grade bonds. SPDR Bloomberg Barclays High Yield Bond (JNK) is up 8% (in price-only terms) for the past year and its 50-day average remains well above its 200-day average.
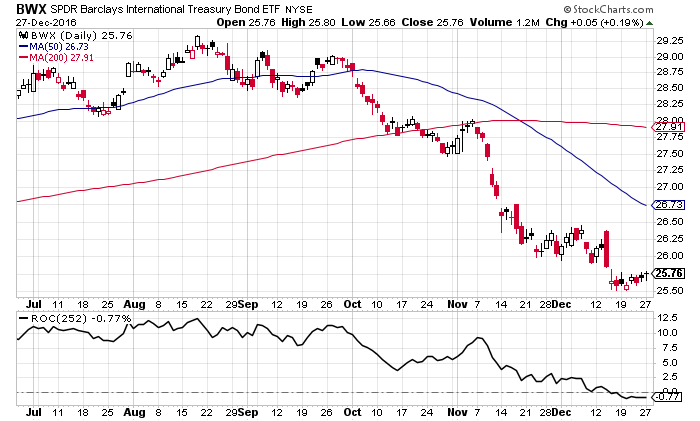
Moving on to foreign bonds, the trends don’t look encouraging at the moment. Government bonds in developed markets-ex US are clearly suffering, based on SPDR Bloomberg Barclays International Treasury Bond (BWX) Note: a glitch in the price-only charting data requires us to look at a total-return chart in this case.
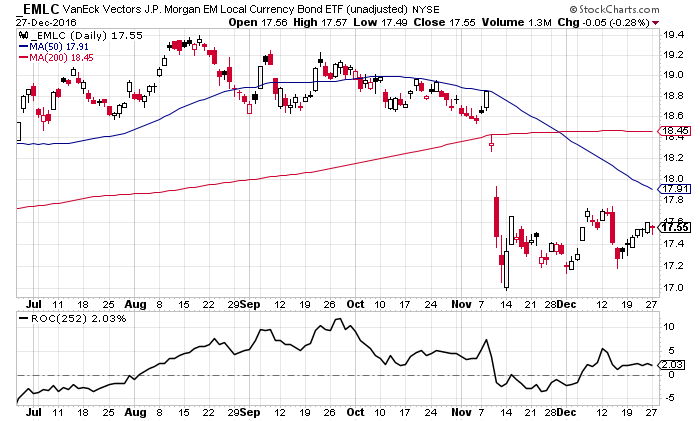
Government bonds in emerging markets look slightly better, but not by much. VanEck Vectors JP Morgan Emerging Markets Local Currency Bond (EMLC) has a modest gain for the trailing one-year period (price-only return), but the technical profile has turned bearish lately (50-day average is below the 200-day average).
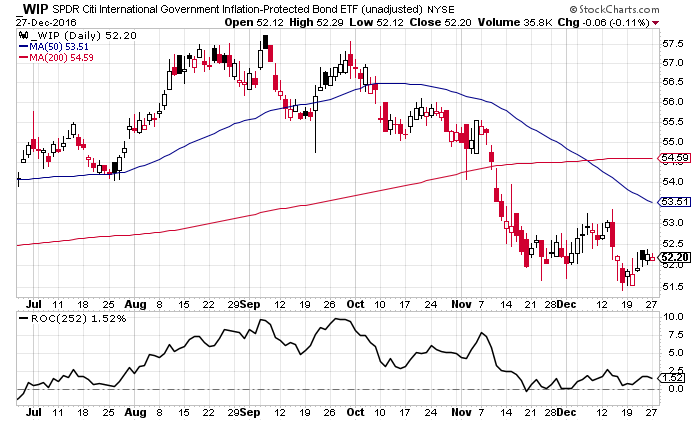
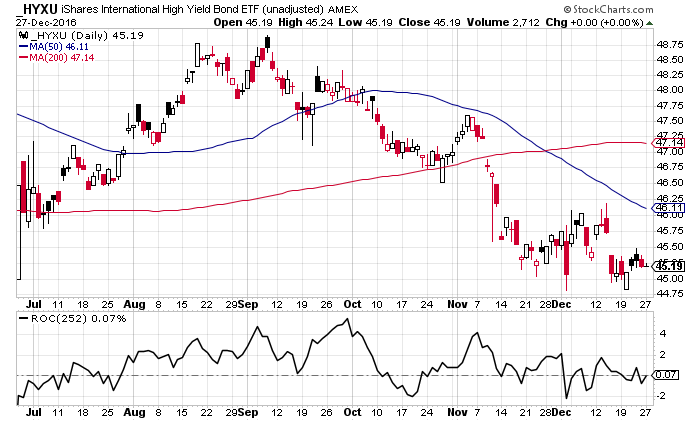
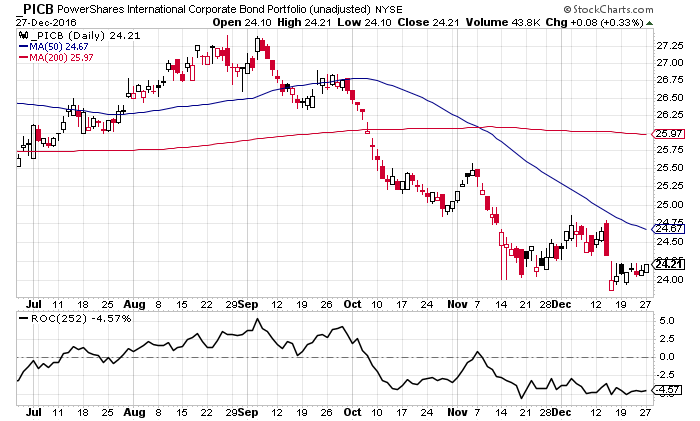
Finally, mixed-to-bearish profiles dominate foreign bonds in the corporate, high-yield, and inflation-indexed sectors. In all three cases, the 50-day average is well below the 200-day average. SPDR Citi International Government Inflation Protected Bond (WIP) is sitting on a slightly positive one-year gain, while iShares International High Yield Bond (HYXU) is essentially flat for the trailing one-year window, and PowerShares International Corporate Bond (PICB) is underwater by roughly 4.6% (price-only data). In short, the near-term outlook for this trio looks weak.
Disclosure: None.


Given the sell off in bonds while U.S. stocks have made new highs, do these bond ETFs offer better relative value than U.S. stocks at this point? How about compared to international stocks which have also underperformed recently?
Nick de Peyster
http://undervaluedstocks.info/