
The National Association of Realtors released the November data for their Pending Home Sales Index. According to the National Association of Realtors®, "Pending home sales slid for the sixth consecutive month in November."
WASHINGTON (December 28, 2022) – Pending home sales slid for the sixth consecutive month in November, according to the National Association of REALTORS®. All four U.S. regions recorded month-over-month decreases, and all four regions saw year-over-year declines in transactions.
"Pending home sales recorded the second-lowest monthly reading in 20 years as interest rates, which climbed at one of the fastest paces on record this year, drastically cut into the number of contract signings to buy a home," said NAR Chief Economist Lawrence Yun. "Falling home sales and construction have hurt broader economic activity."
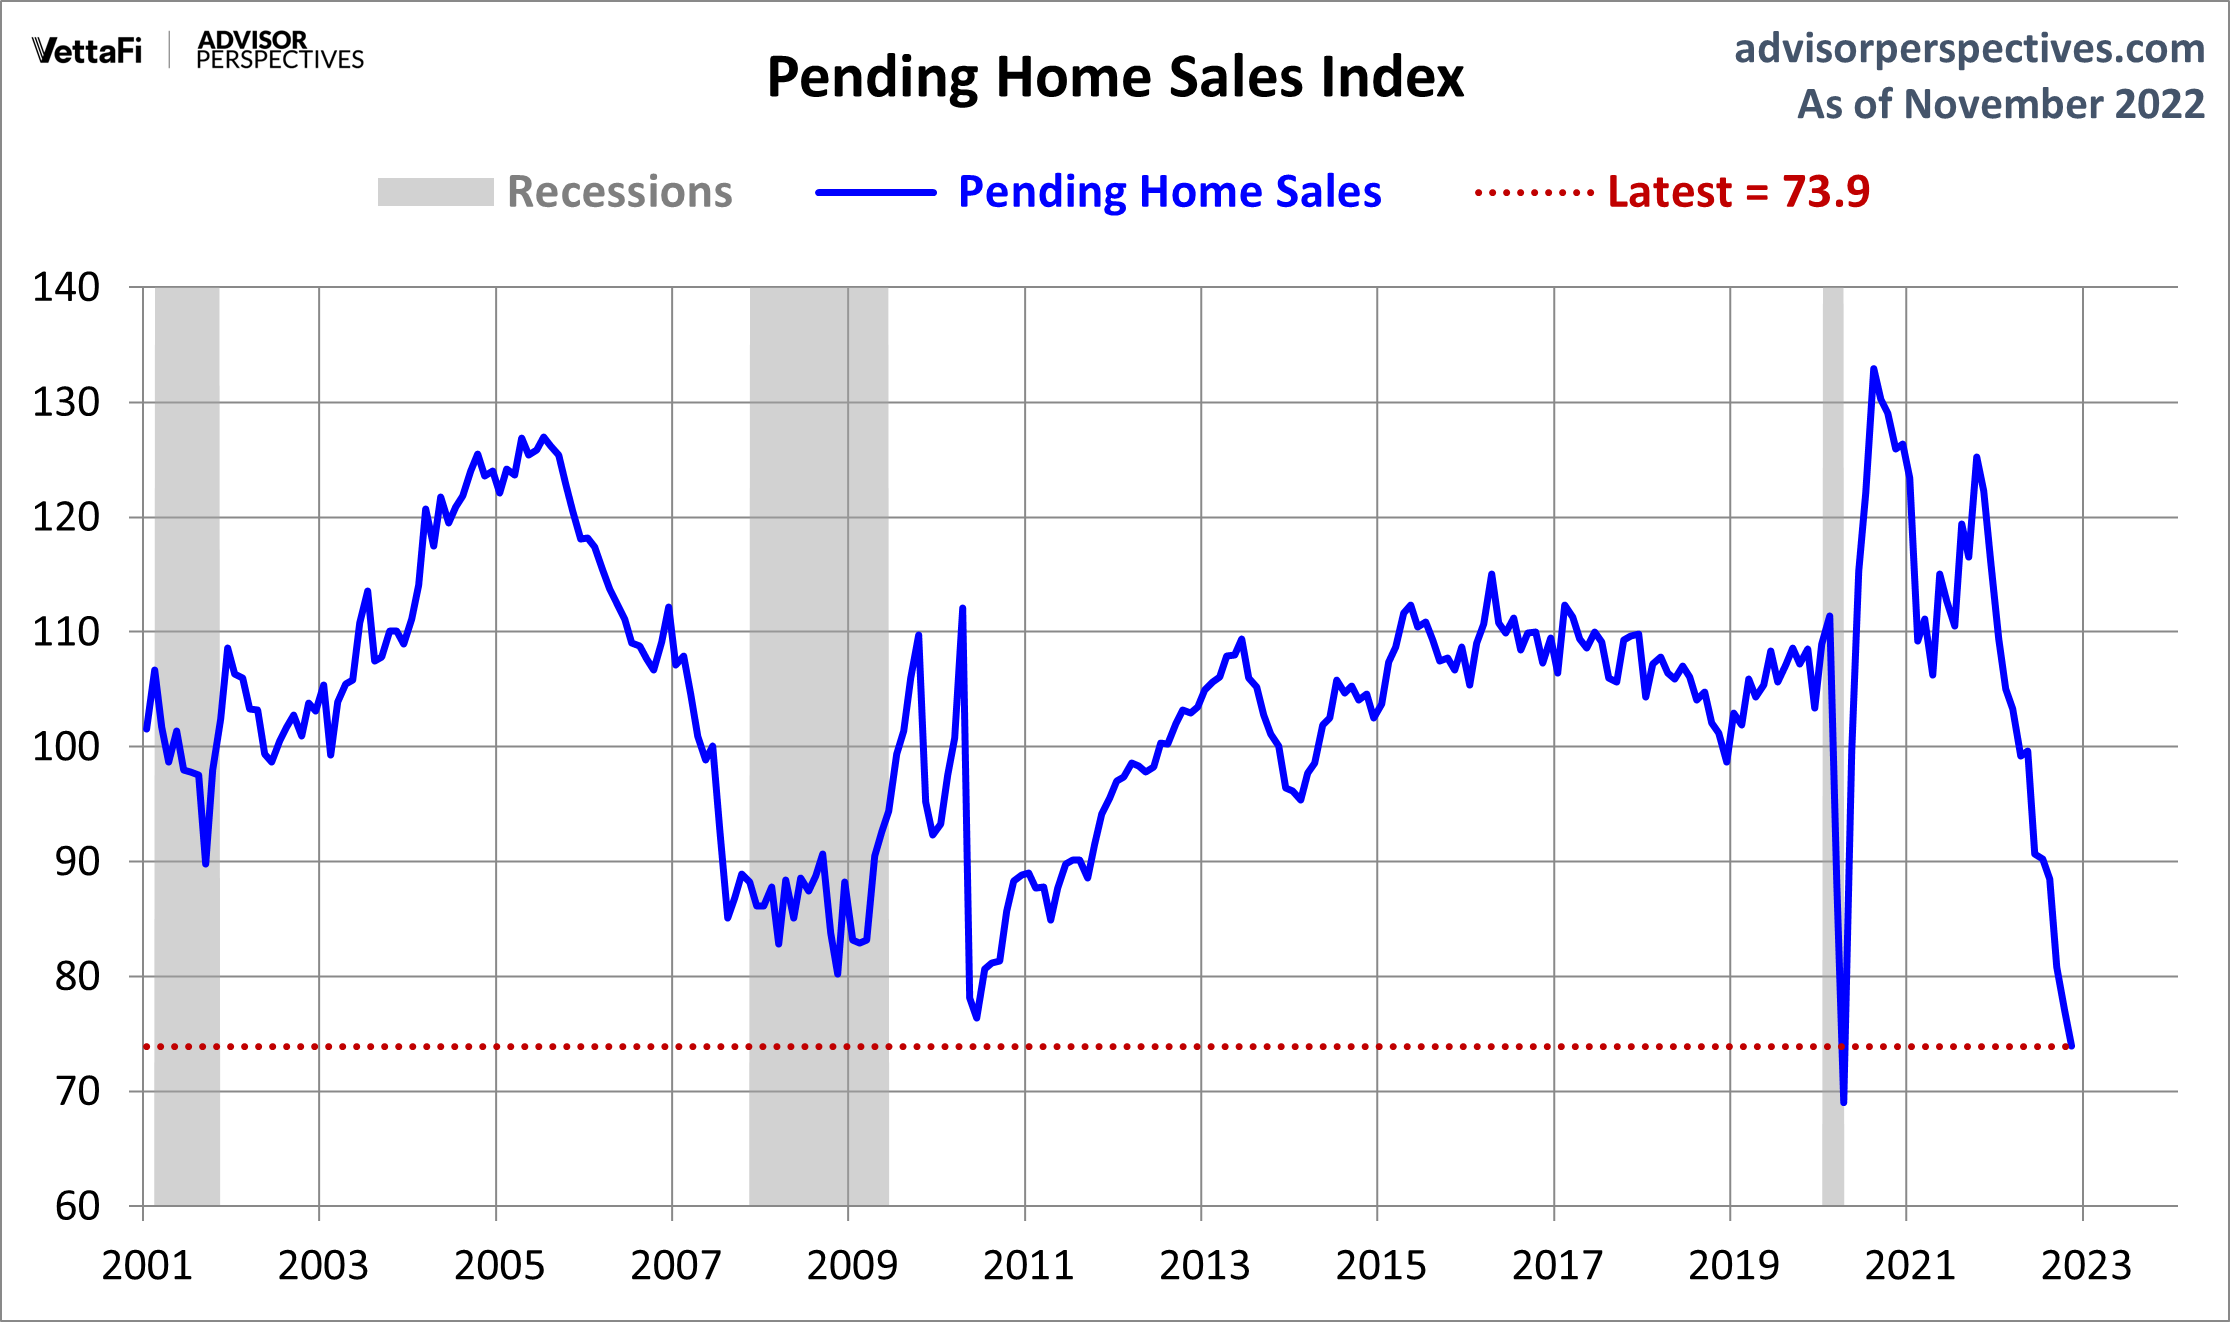
The Pending Home Sales Index (PHSI)* — a forward-looking indicator of home sales based on contract signings — fell 4.0% to 73.9 in November. Year-over-year, pending transactions dropped by 37.8%. An index of 100 is equal to the level of contract activity in 2001.
"The residential investment component of GDP has fallen for six straight quarters," Yun added. "There are approximately two months of lag time between mortgage rates and home sales. With mortgage rates falling throughout December, home-buying activity should inevitably rebound in the coming months and help economic growth." (more here)
The chart below gives us a snapshot of the index since 2001. The MoM came in at -4.0%, up from a 4.7% decrease last month. Investing.com had forecast a decrease of 0.8%.
Over this time frame, the US population has grown by 17.5%. For a better look at the underlying trend, here is an overlay with the nominal index and the population-adjusted variant. The focus is pending home sales growth since 2001.
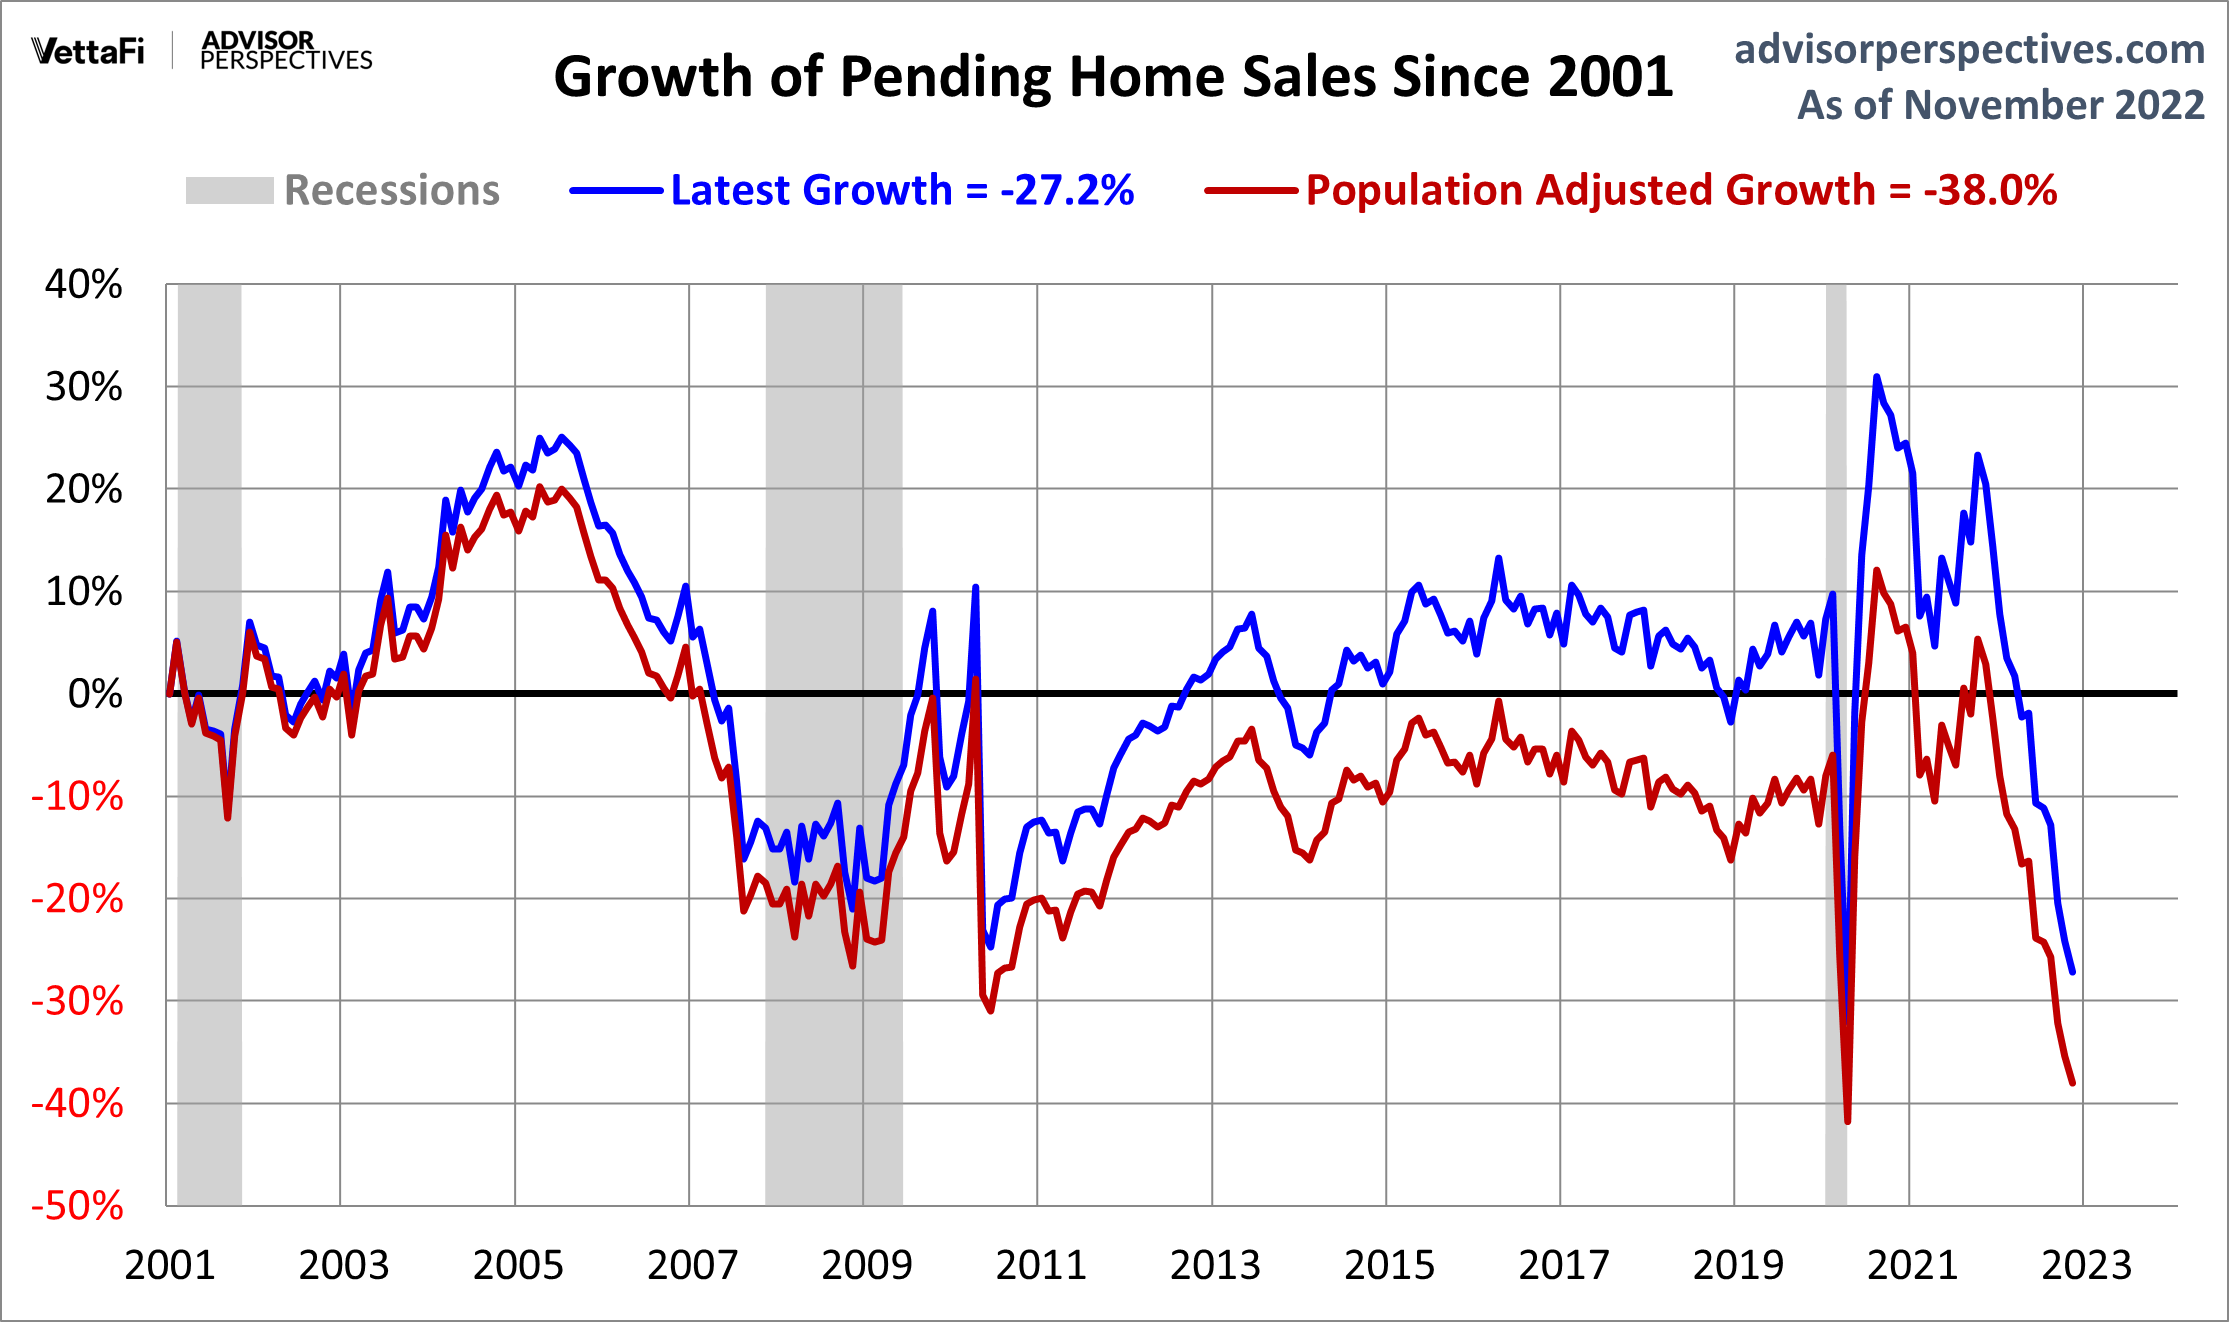
The above chart shows the percent off turn-of-the-century values. The index for the most recent month is currently 44% below its all-time high. The population-adjusted index is 48% off its high.
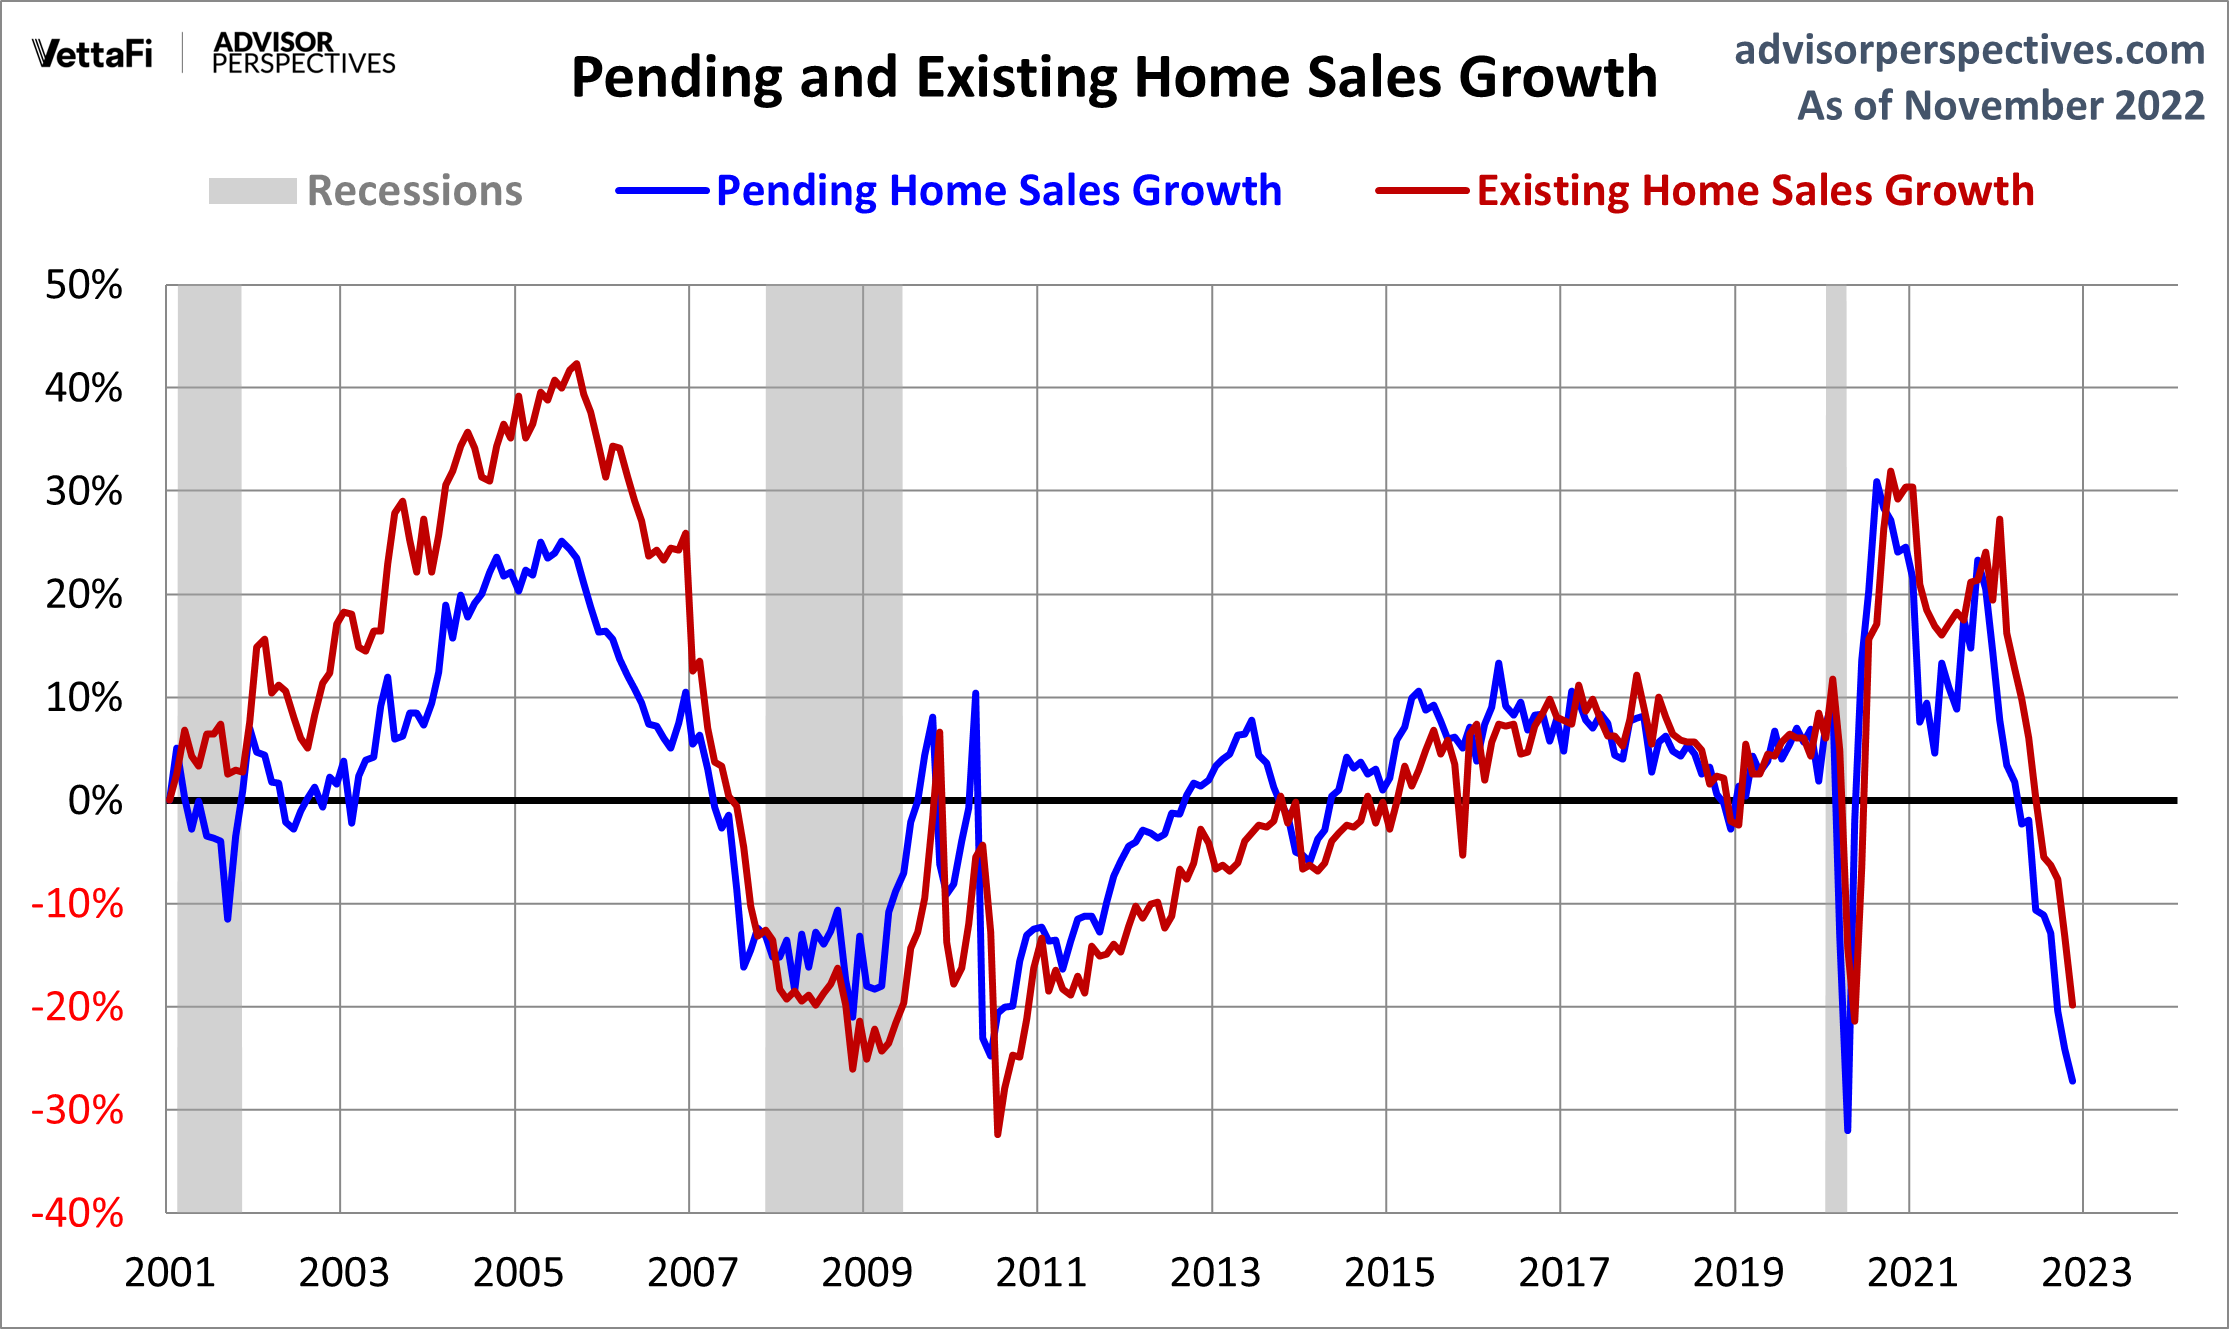
Pending versus Existing Home Sales
The NAR explains that "because a home goes under contract a month or two before it is sold, the Pending Home Sales Index generally leads Existing-Home Sales by a month or two." Here is a growth overlay of the two series. The general correlation, as expected, is close. And a close look at the numbers supports the NAR's assessment that their pending sales series is a leading index.
More By This Author:
Weekly Gasoline Prices: Regular And Premium Down AgainWorld Markets Update - Tuesday, Dec. 27
CB LEI: Currently In A Recession?


Comments
Log in or sign up to join the conversation.