
The BEA's Personal Income and Outlays report for December was published on Friday morning by the Bureau of Economic Analysis.

The latest Headline PCE price index was up 0.05% month-over-month (MoM) and is up 5.02% year-over-year (YoY). Core PCE (YoY) dropped to 4.42%, still well above the Fed's 2% target rate.

The adjacent thumbnail gives us a close-up of the trend in YoY core PCE since January 2012. The first string of red data points highlights the 12 consecutive months when core PCE hovered in a narrow range around its interim low. The second string highlights the lower range from late 2014 through 2015. Core PCE shifted higher in 2016 with a decline in 2017, 2019, and 2020, with a major jump in 2022.
The first chart below shows the monthly year-over-year change in the personal consumption expenditures (PCE) price index since 2000. Also included is an overlay of the core PCE (less food and energy) price index, which is Fed's preferred indicator for gauging inflation. The 2% benchmark is the Fed's conventional target for core inflation. Most recently, the Fed reviewed its monetary policy strategy and longer-term goals and released a statement, mentioning its federal mandate to promote "maximum employment, stable prices, and moderate long-term interest rates." It also confirmed its commitment to using the 2% benchmark as a lower limit:
"The inflation rate over the longer run is primarily determined by monetary policy, and hence the Committee has the ability to specify a longer-run goal for inflation. The Committee reaffirms its judgment that inflation at the rate of 2 percent, as measured by the annual change in the price index for personal consumption expenditures, is most consistent over the longer run with the Federal Reserve's statutory mandate. The Committee judges that longer-term inflation expectations that are well anchored at 2 percent foster price stability and moderate long-term interest rates and enhance the Committee's ability to promote maximum employment in the face of significant economic disturbances. In order to anchor longer-term inflation expectations at this level, the Committee seeks to achieve inflation that averages 2 percent over time, and therefore judges that, following periods when inflation has been running persistently below 2 percent, appropriate monetary policy will likely aim to achieve inflation moderately above 2 percent for some time." Read the August 2020 statement here

The index data is shown to two decimal points to highlight the change more accurately. It may seem trivial to focus such detail on numbers that will be revised again next month (the three previous months are subject to revision and the annual revision reaches back three years). But core PCE is such a key measure of inflation for the Federal Reserve that precision seems warranted.
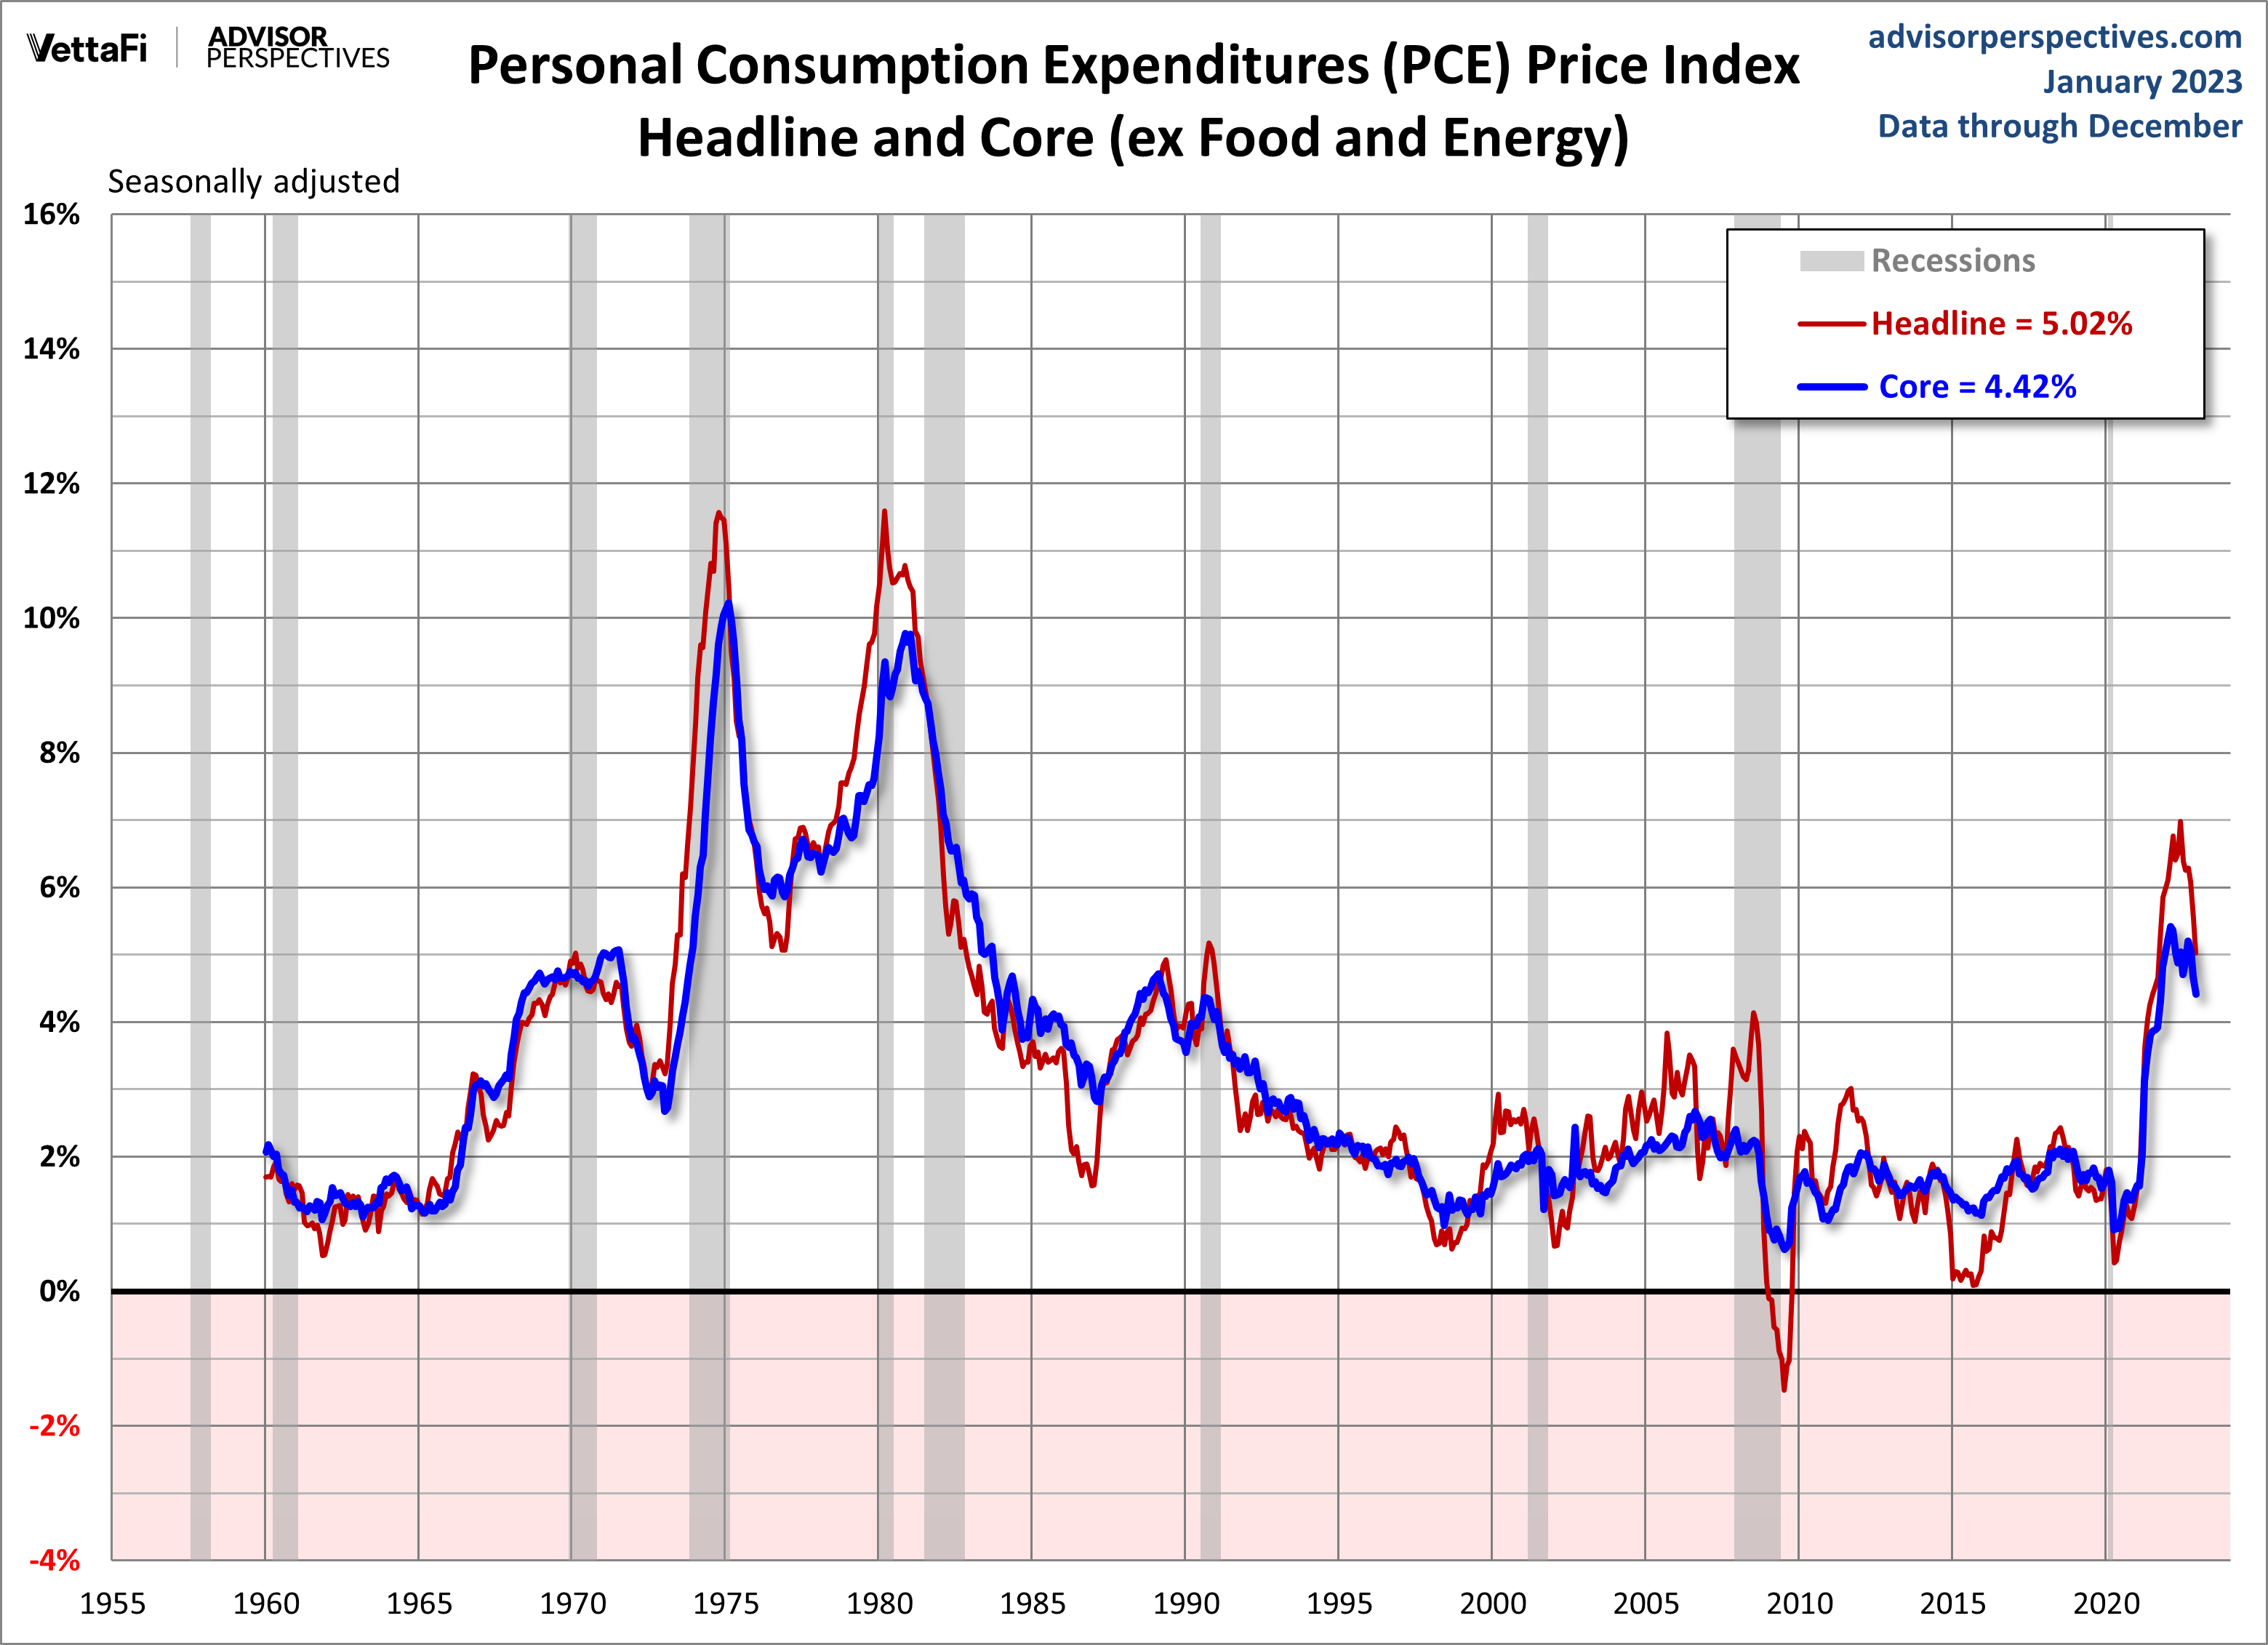
For a long-term perspective, here are the same two metrics spanning five decades.
Note: The data source is Table 9 in the Excel file available in the right-hand column of the BEA's report page.
More By This Author:
Real Disposable Income Per Capita Continued To Inch Up In December
S&P 500 Snapshot: Friday Ends Up 0.25%
CFNAI Components: Employment, Production, Consumption, Sales


Comments
Log in or sign up to join the conversation.