
Note that this article was originally written by Doug Short. From 2016-2022, it was improved upon and updated by Jill Mislinski. Starting in January 2023, AP Charts pages will be maintained by Jennifer Nash at Advisor Perspectives/VettaFi.

Image Source: Unsplash
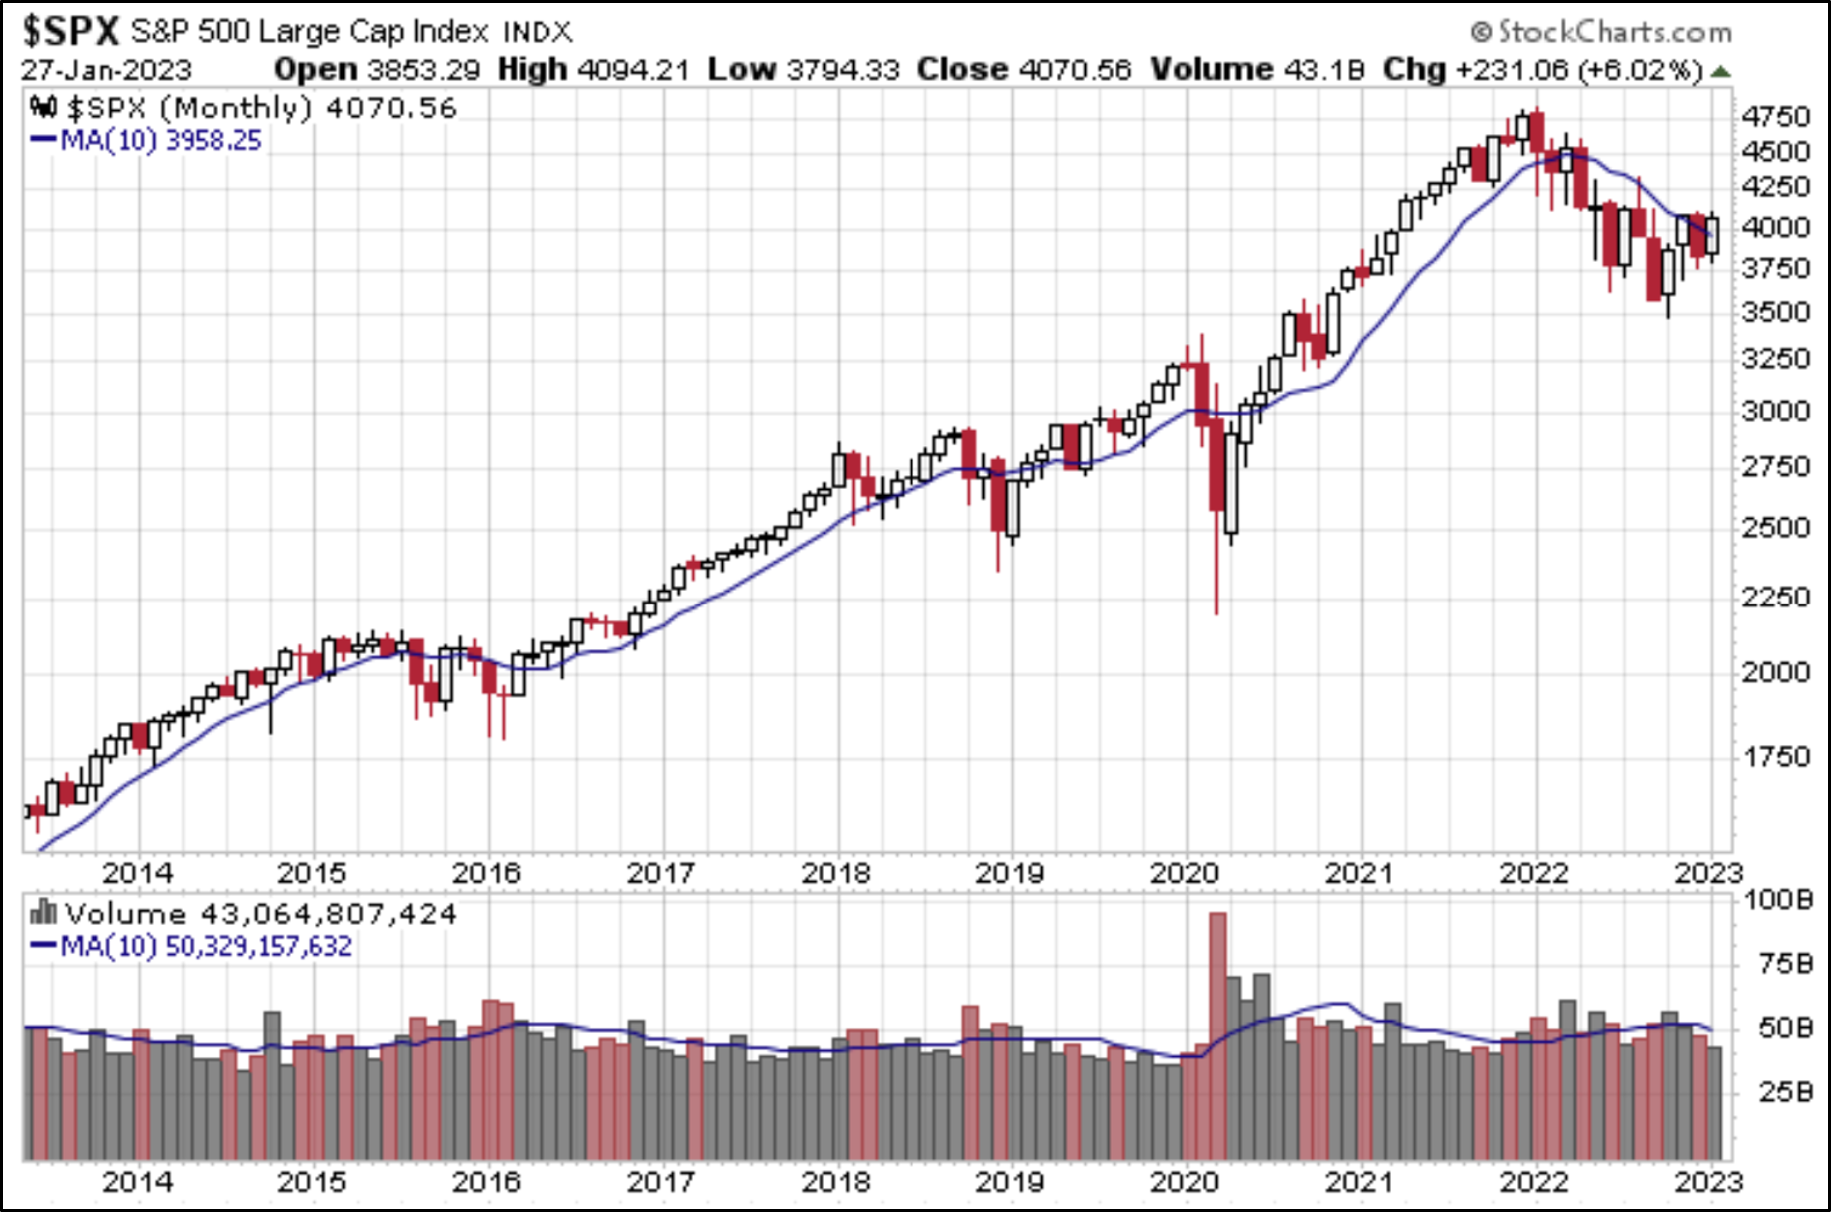
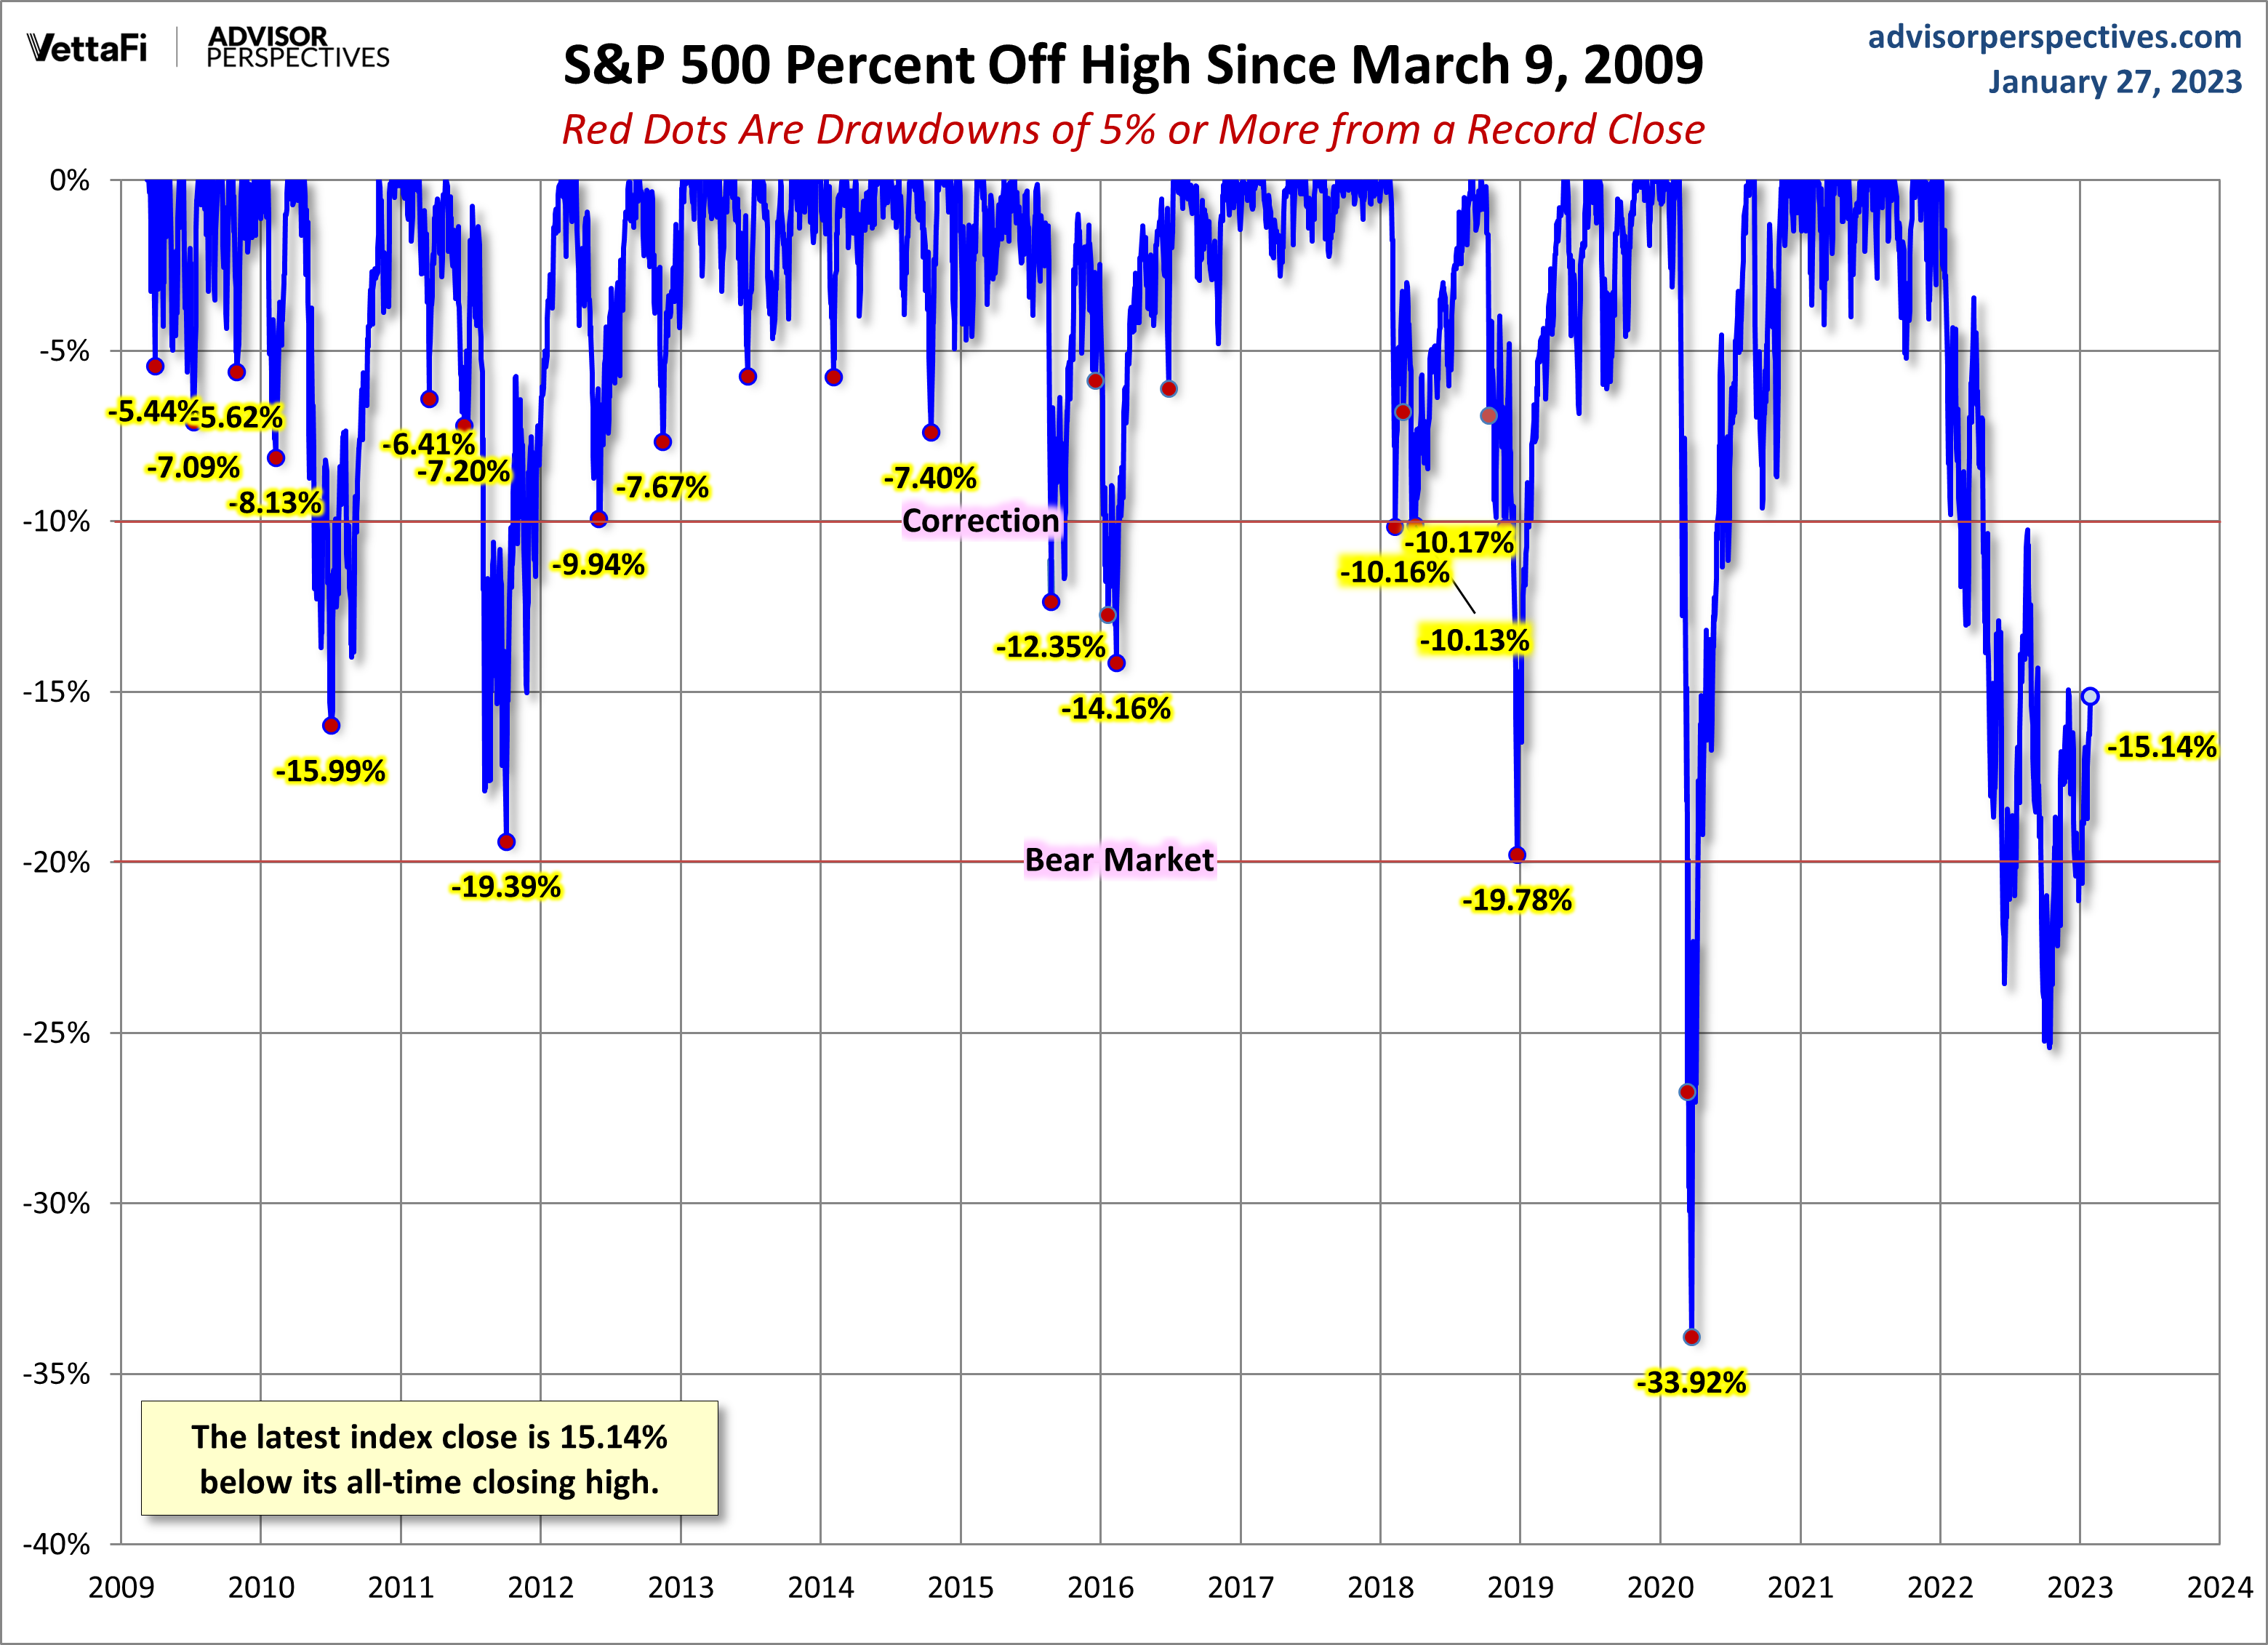
The S&P 500 climbed for most of the week, ending with its highest close of the year on Friday. The index is up 6.04% year-to-date and is 15.14% below its record close.

The U.S. Treasury put the closing yield on the 10-year note, as of Jan. 27, at 3.52% which is above its record low (0.52% on Aug. 4, 2020). The 2-year note is at 4.19%. See our latest Treasury Snapshot here.

Here's a snapshot of the index going back to 2013.
A Perspective on Drawdowns
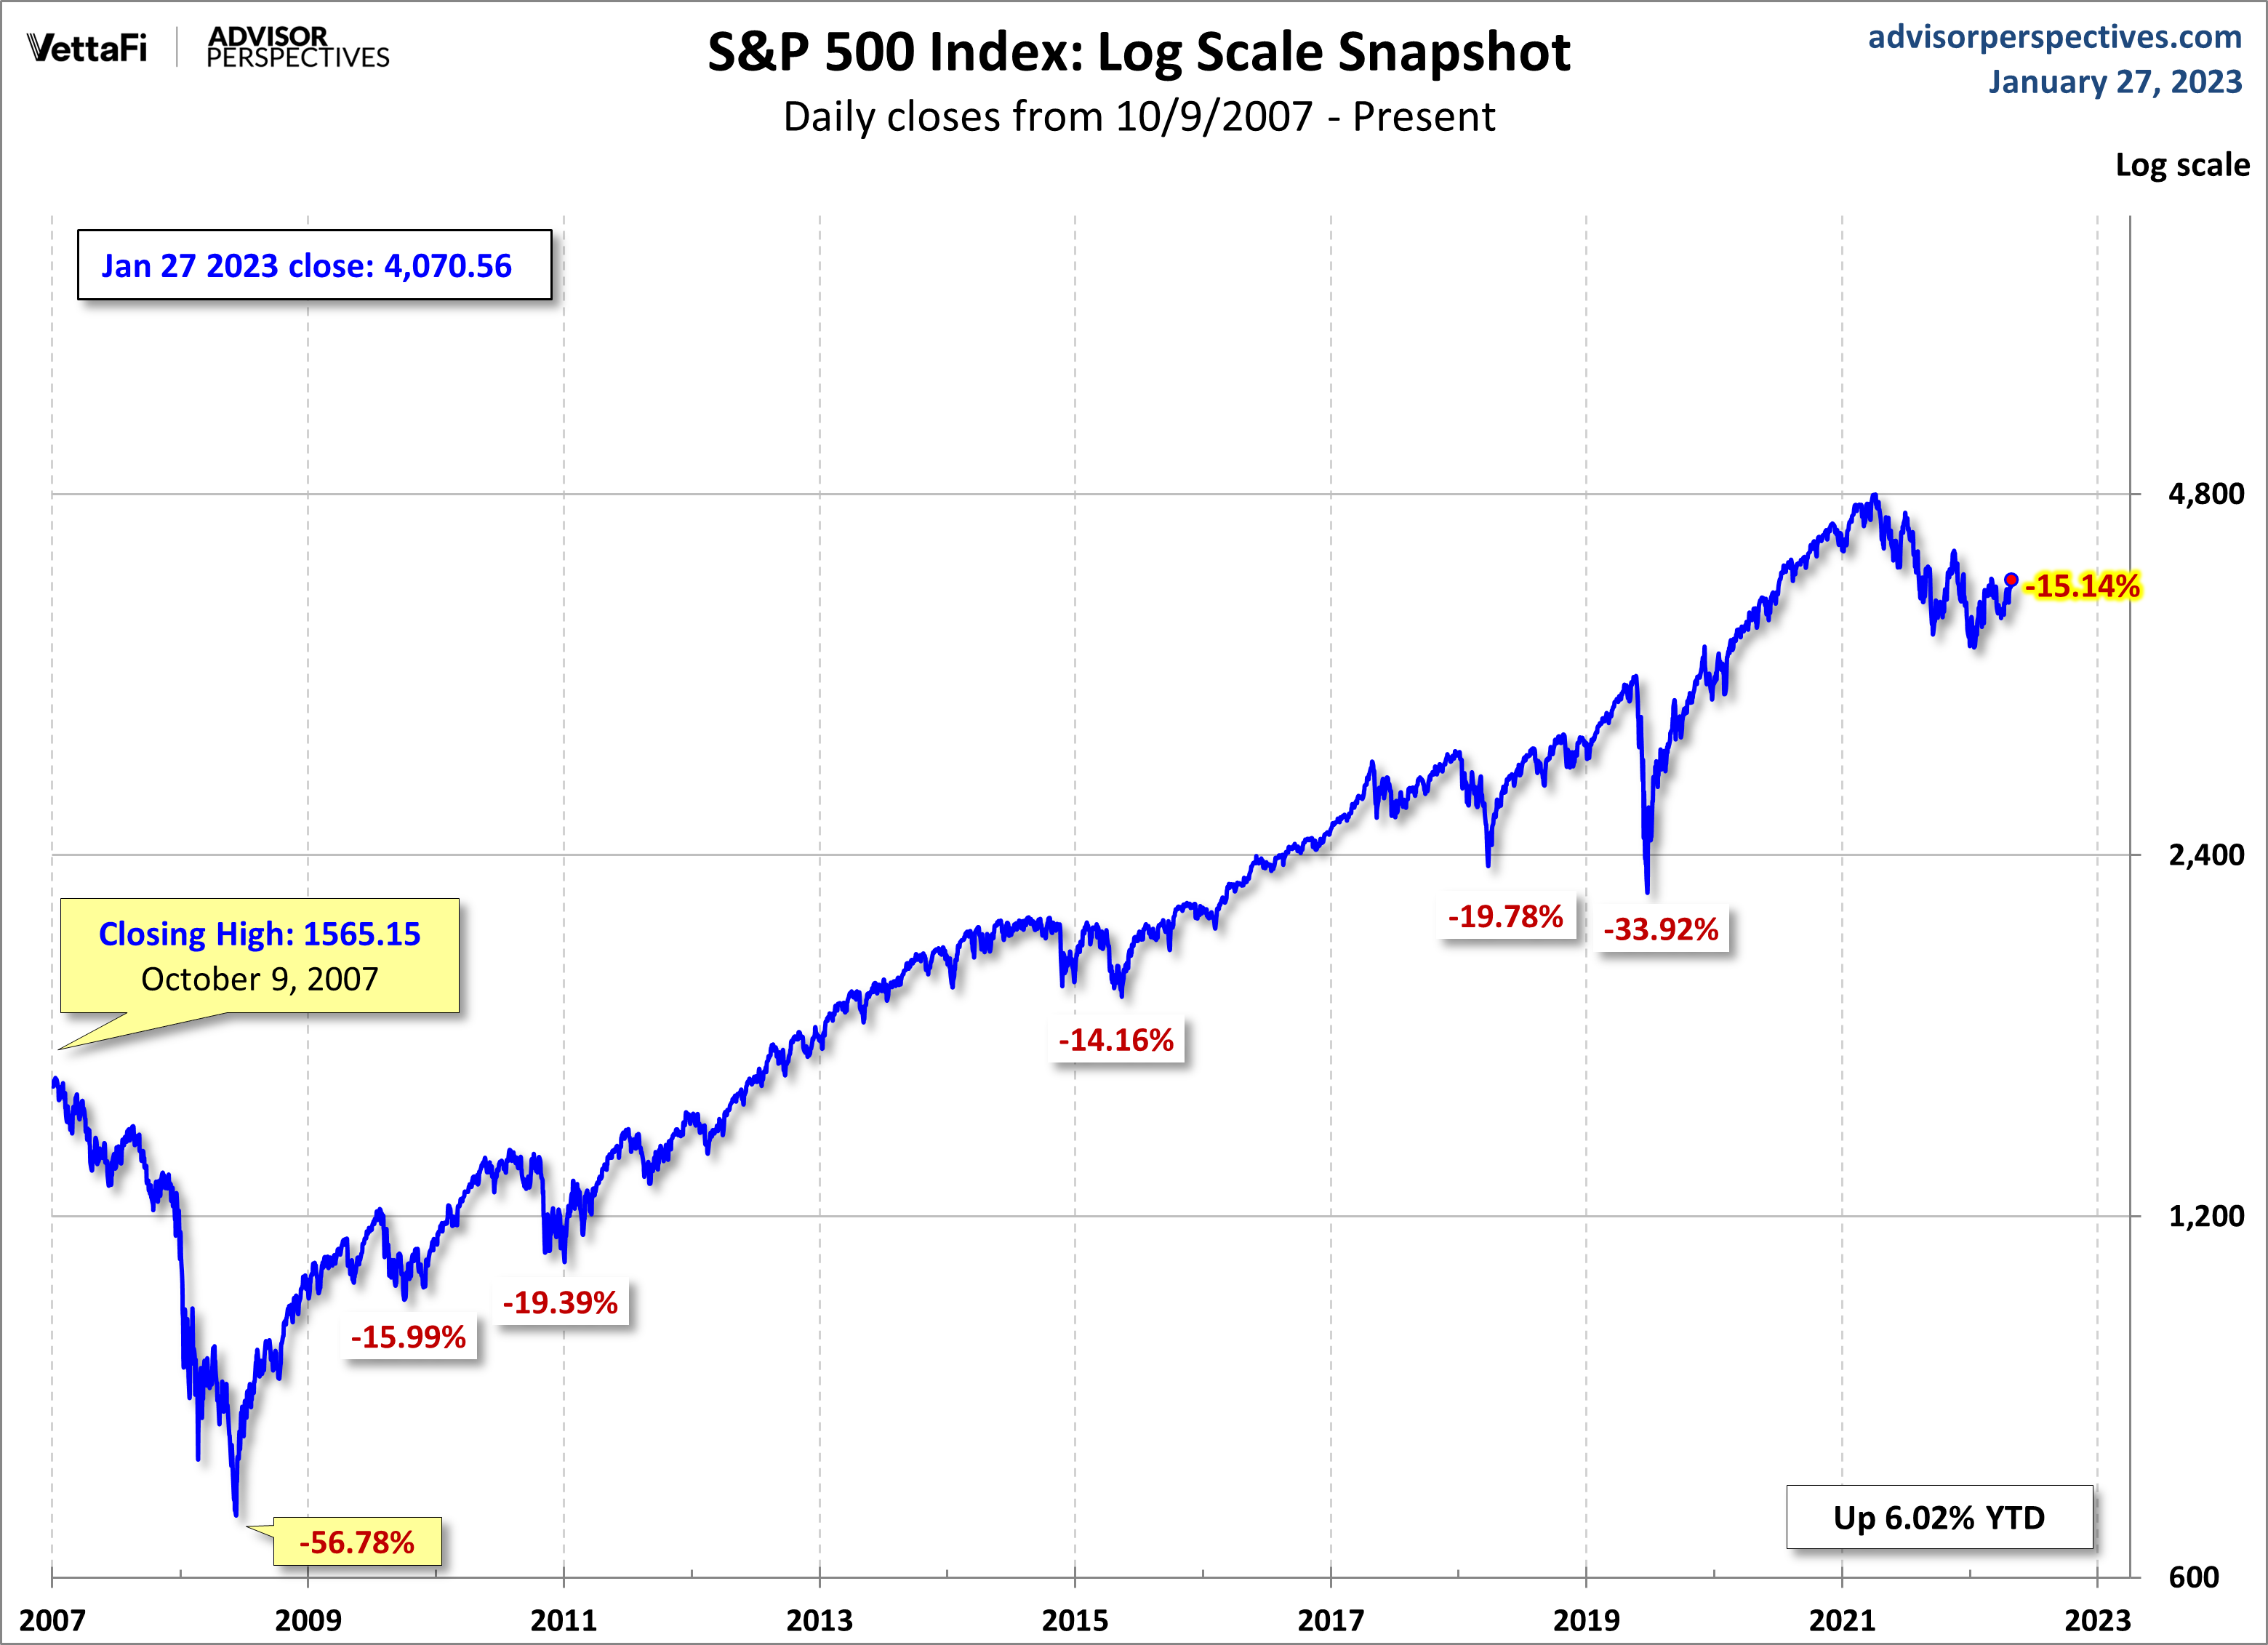
Here's a snapshot of record highs and selloffs since the 2009 trough. Note the recent selloffs in 2022.
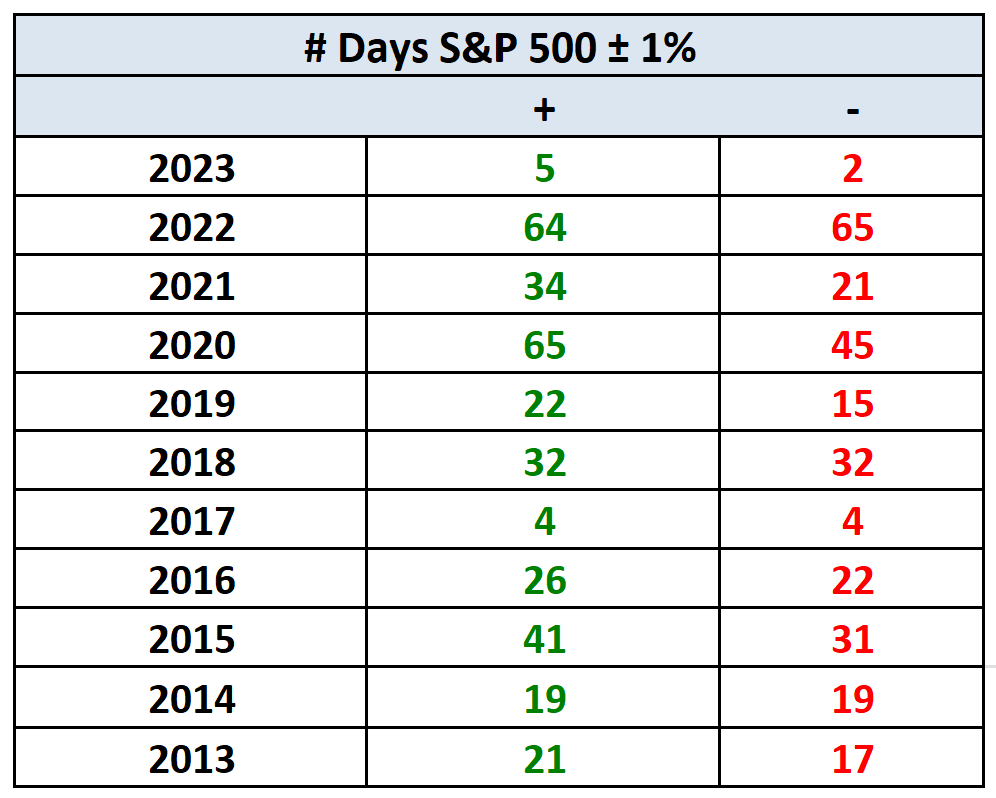
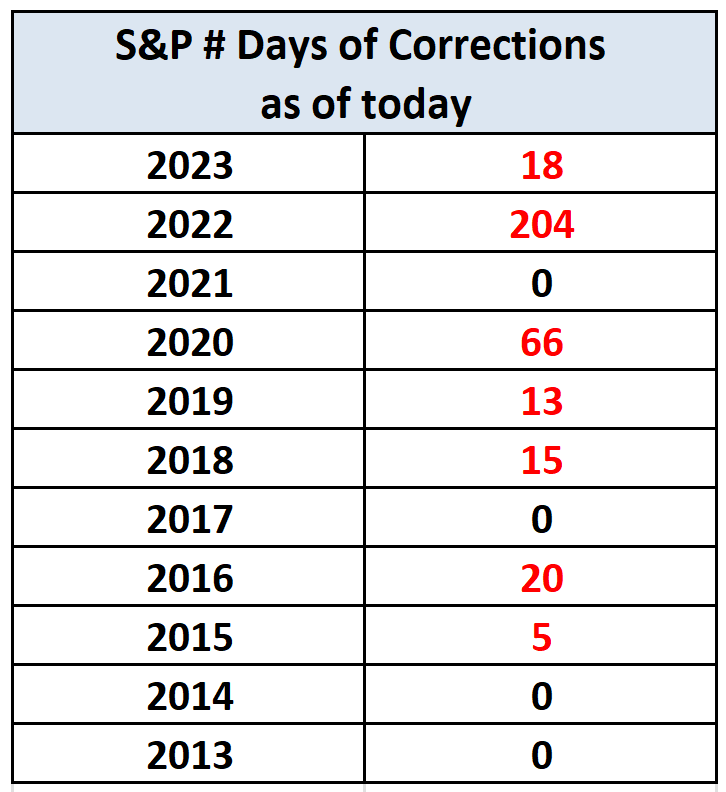
Here's a table with the number of days of a 1% or greater change in either direction, and the number of days of corrections (down 10% or more from the record high) going back to 2013.
Here is a more conventional log-scale chart with drawdowns highlighted.
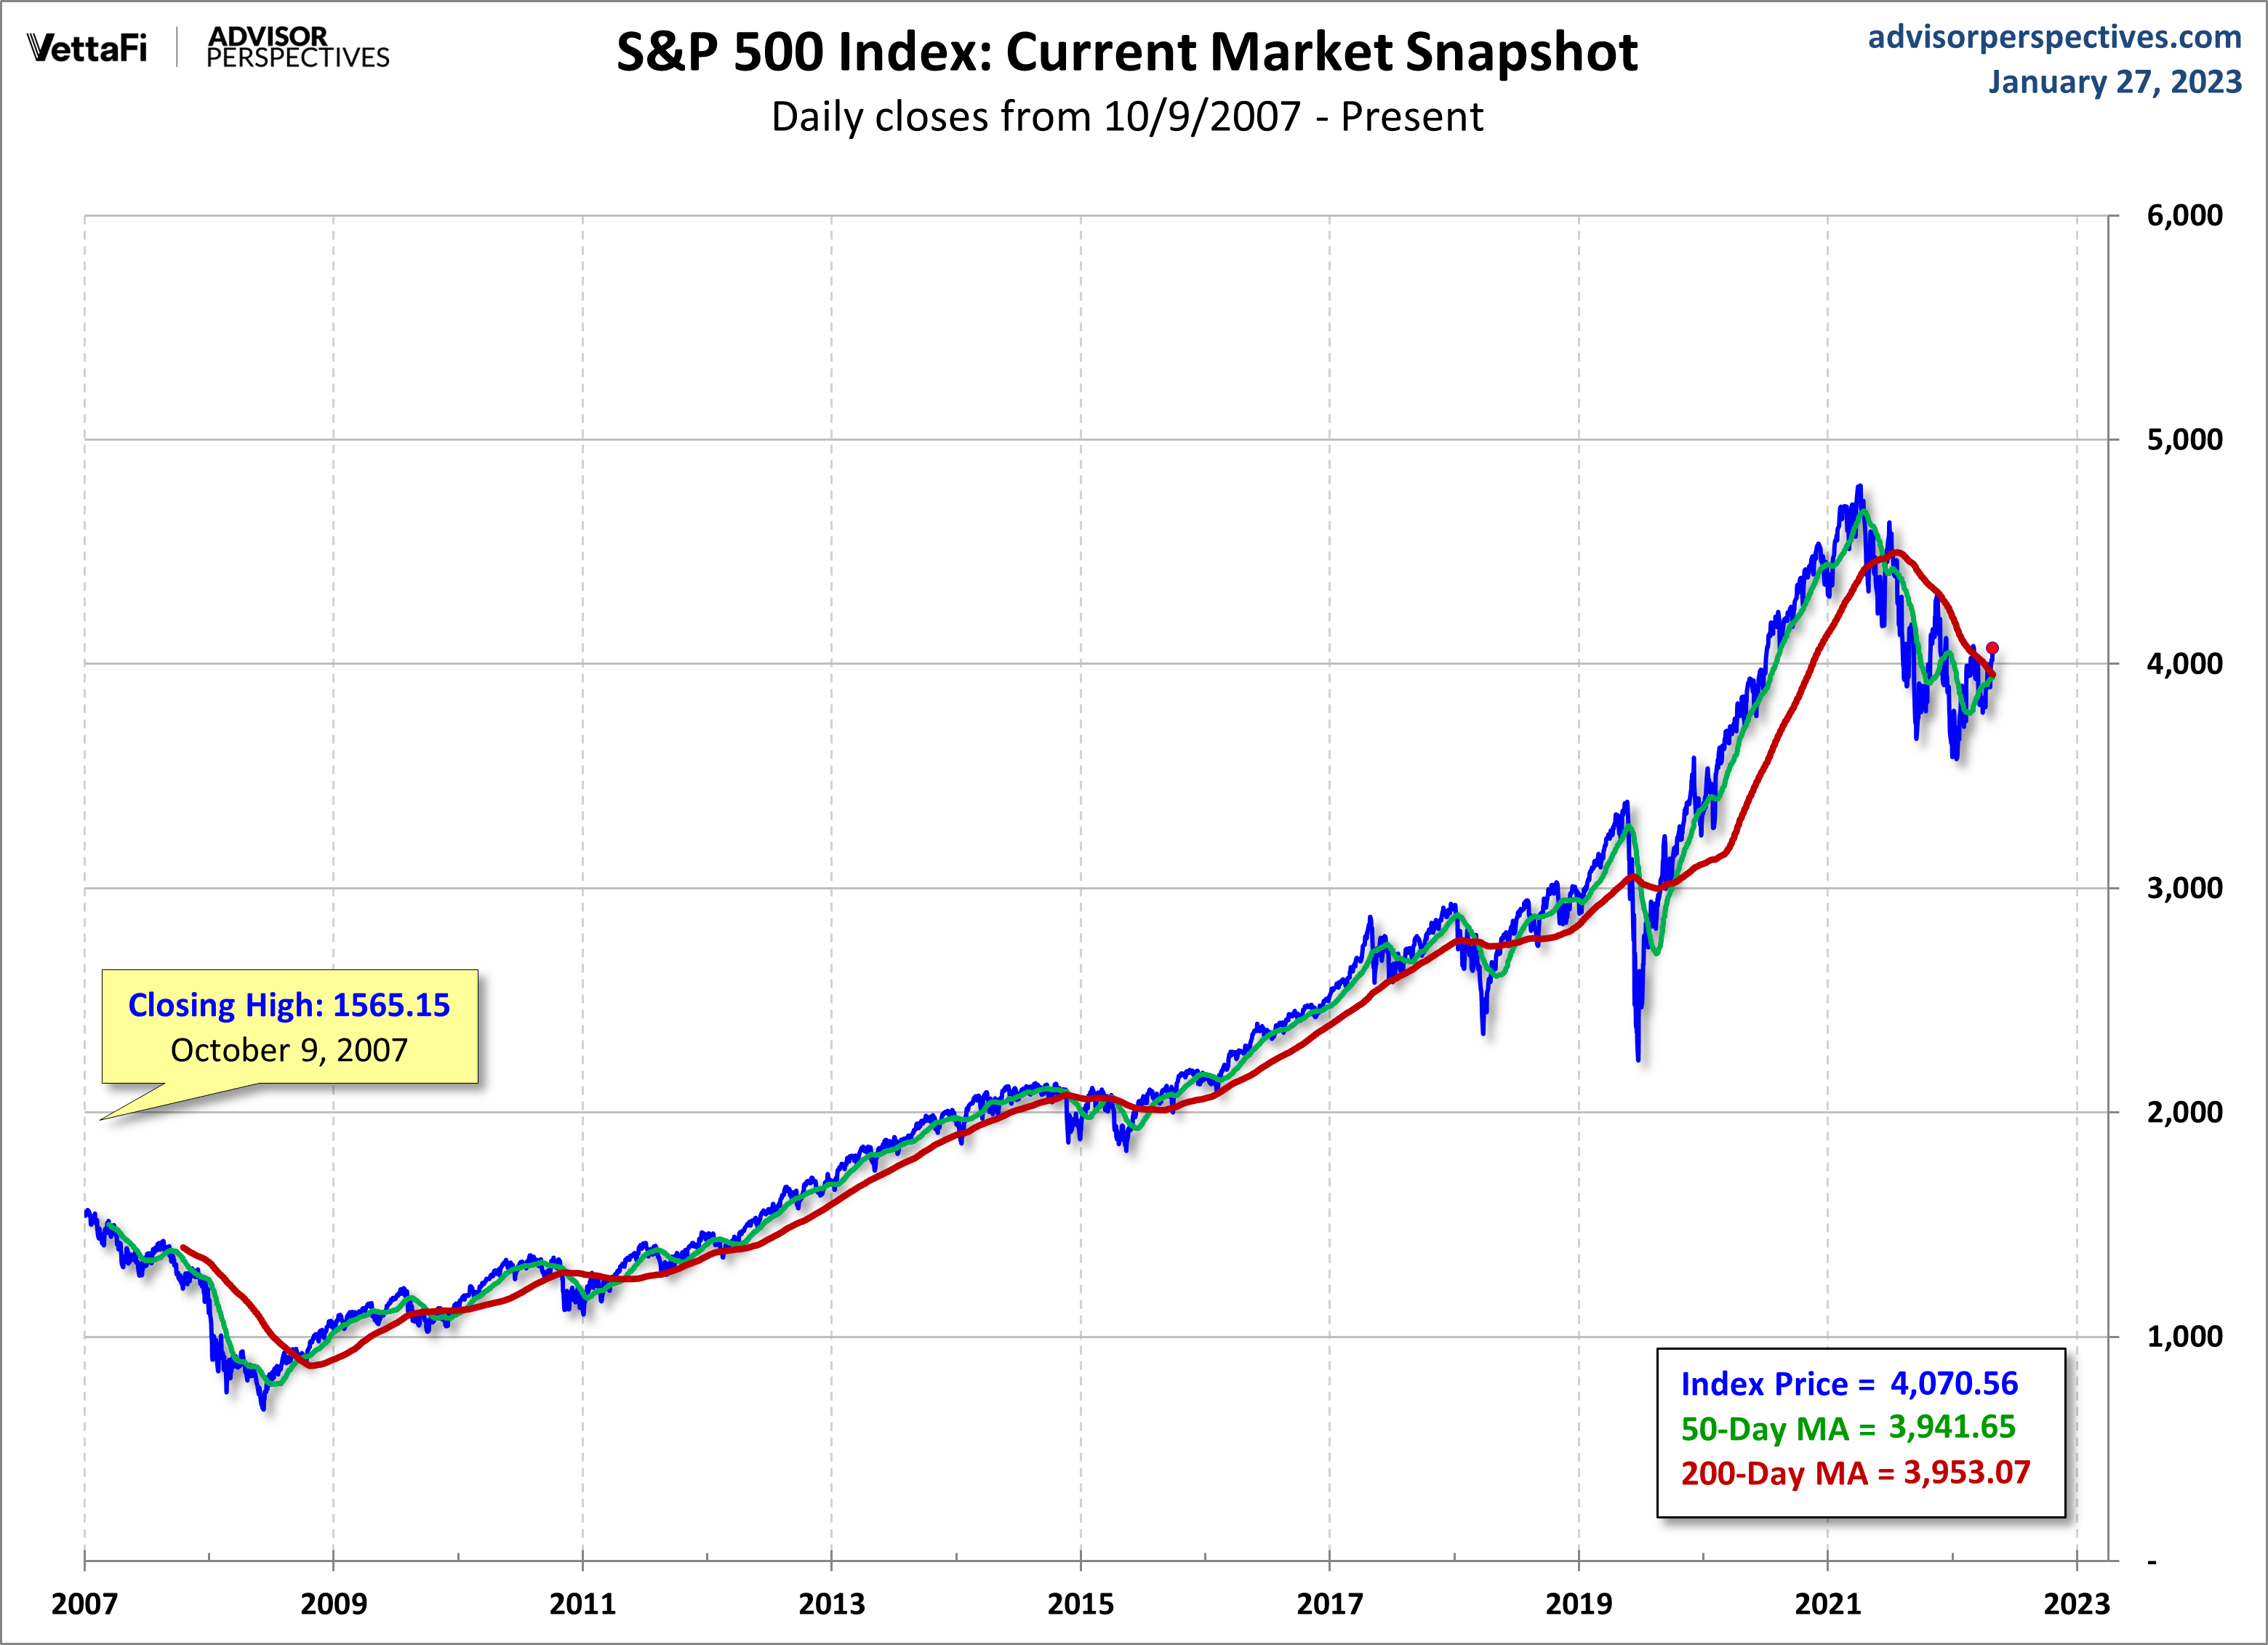
Here is a linearly scaled version of the same chart with the 50- and 200-day moving averages.
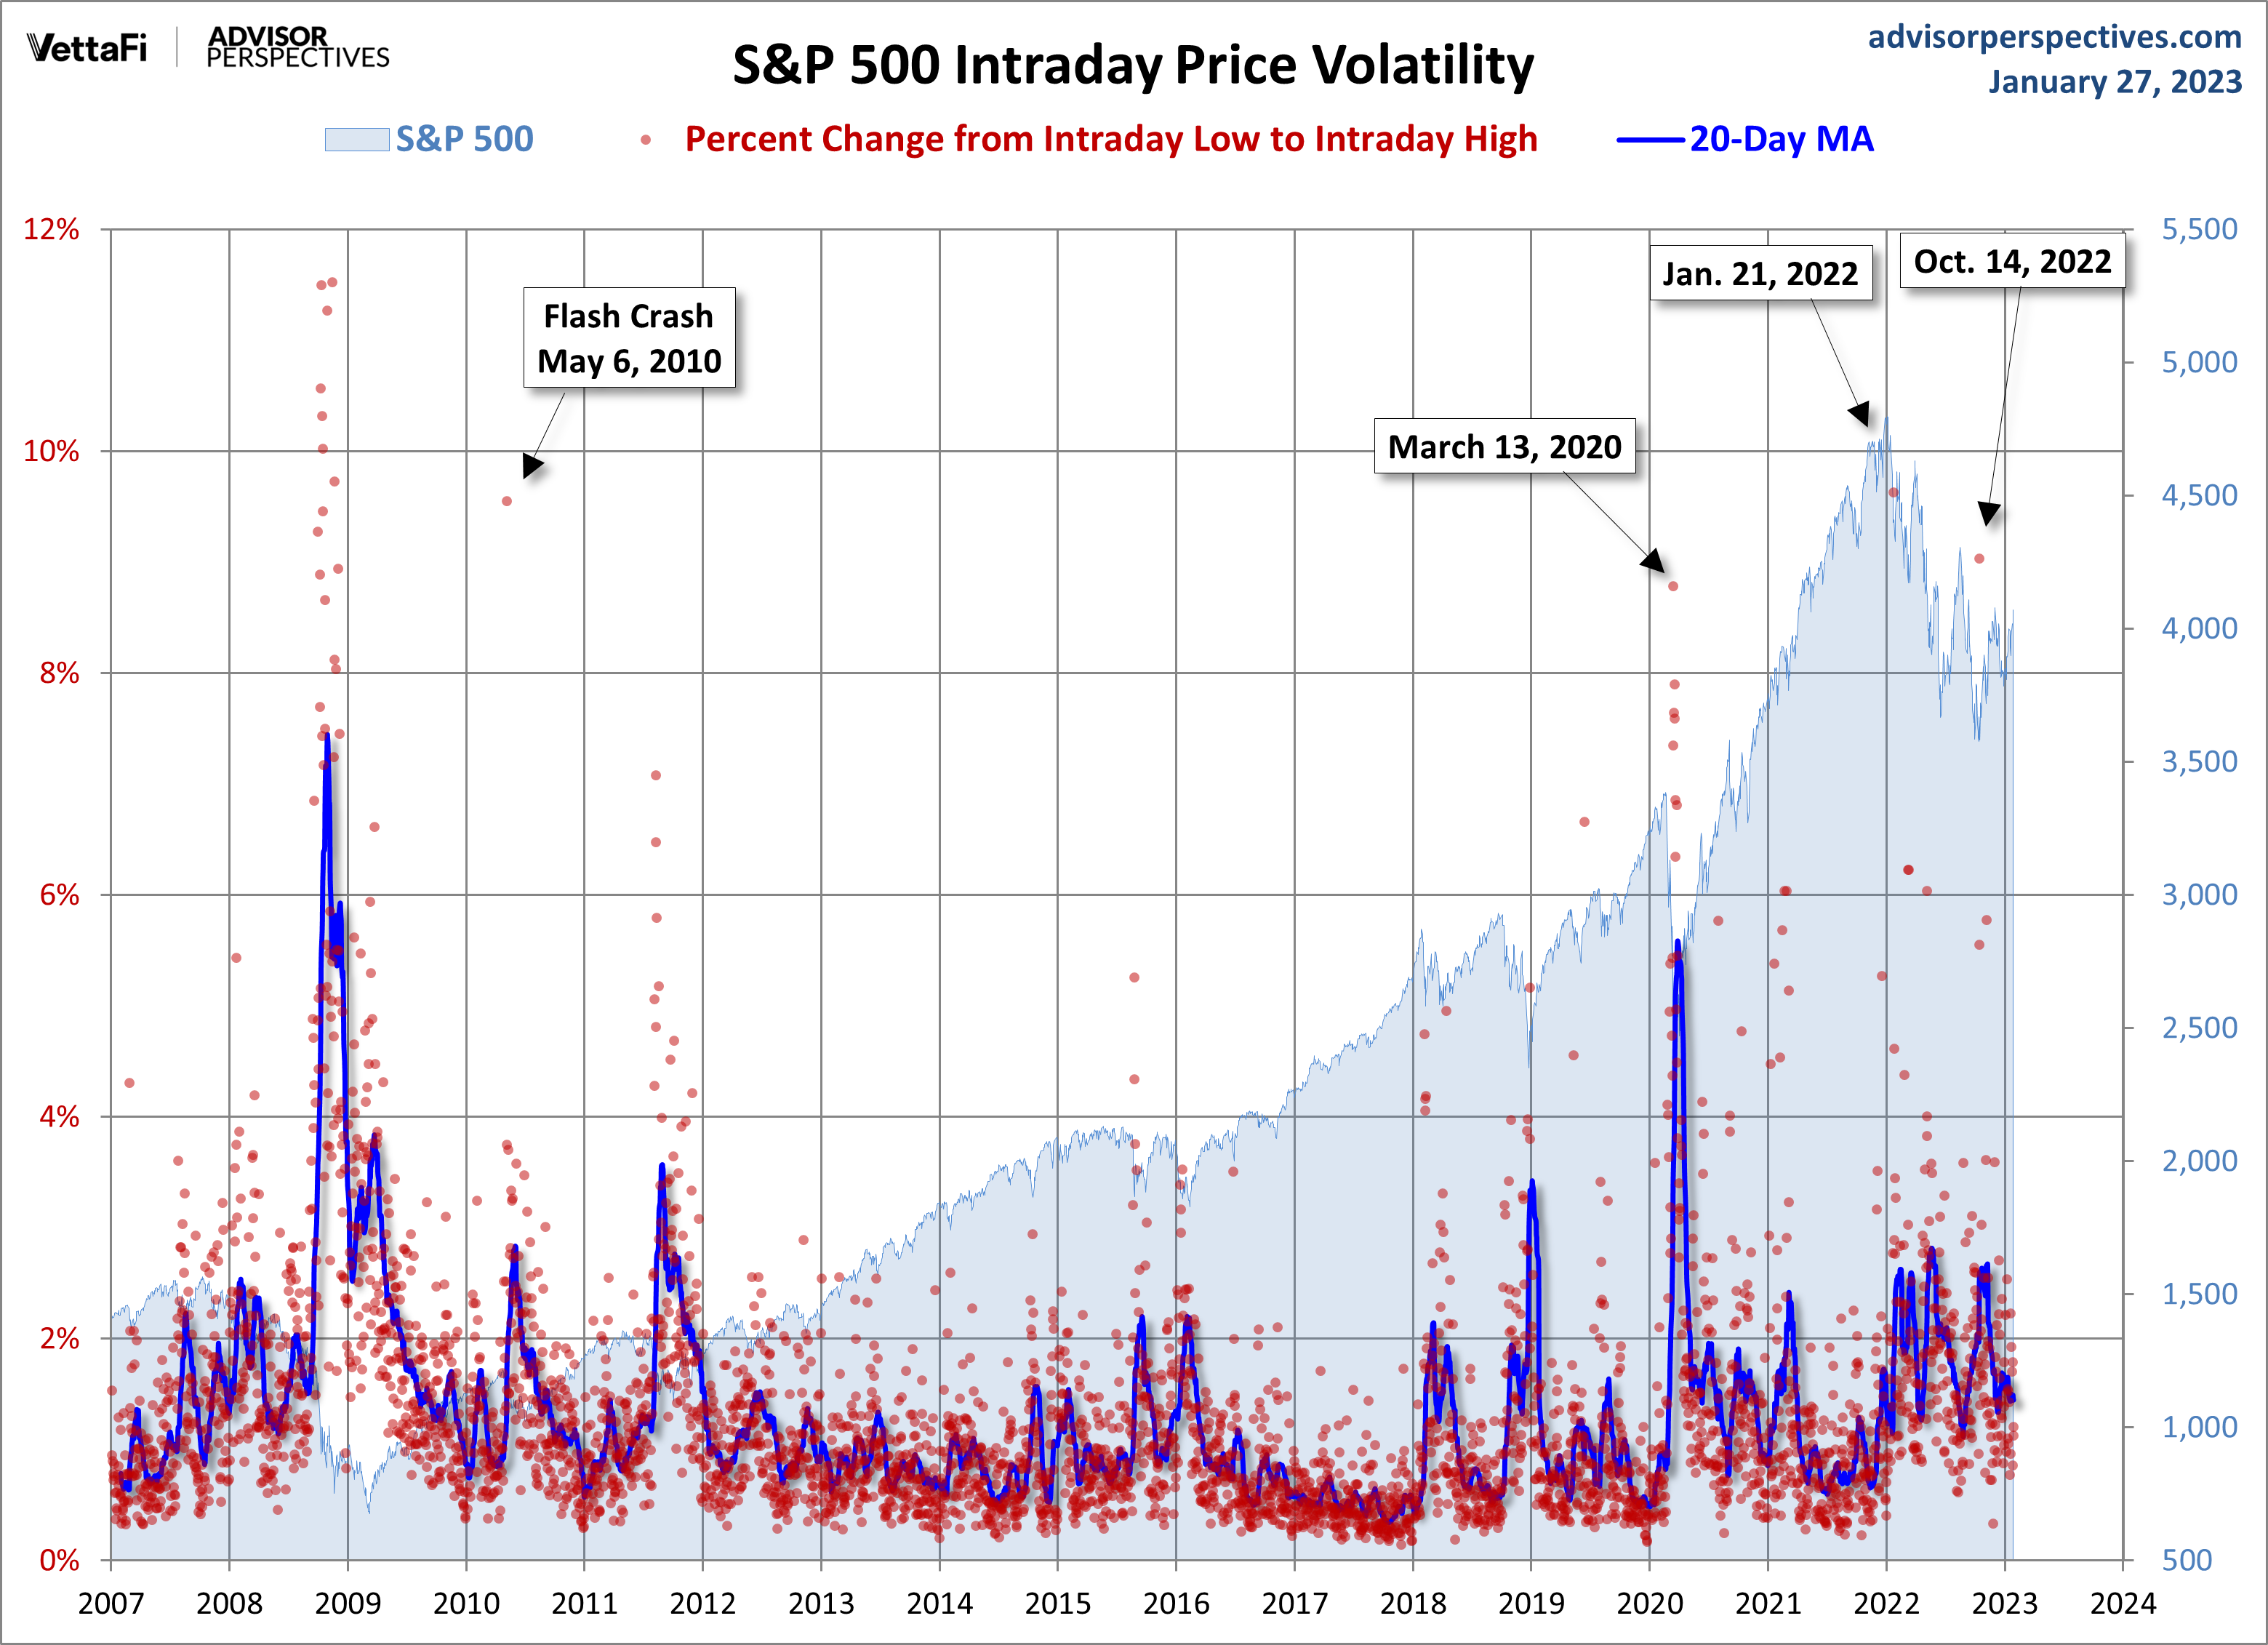
A Perspective on Volatility
For a sense of the correlation between the closing price and intraday volatility, the chart below overlays the S&P 500 since 2007 with the intraday price range. I've also included a 20-day moving average to identify trends in volatility.
More By This Author:
CFNAI Components: Employment, Production, Consumption, SalesQ3 Real GDP Per Capita: 2.5% Vs. The 2.9% Headline Real GDP
Chicago Fed: Little Change In Economic Growth In December


Comments
Log in or sign up to join the conversation.