
Stocks cheered yesterday on news that US households further eroded their savings in July, increasing retail sales by 1% while the average weekly earnings contracted by .1%. Year over year, retail sales volumes are running -.3% and full-time employment -.4%.
Costco and Walmart are the best-performing retail companies. Everyday discounters are some of the few that can grow market share as higher-income earners trade down in a weakening economic environment. Discounter gains reflect lost sales and profits in other sectors. See Walmart is the best-performing retail stock in 2024, with a good reason:
“…the company said higher-income households accounted for most of its market-share gains. At the same time, it is still gaining share with middle- and low-income households by undercutting competition on prices. The company said its prices were slightly lower during the quarter at Walmart U.S. compared with a year earlier, with rollbacks on more than 7,200 items. Rollbacks tend to be funded by manufacturers.
The San Fransisco Fed’s August 12th economic letter, Pandemic-Era Liquid Wealth Is Running Dry, compares the current state of household wealth with pre-pandemic trends across different income levels and offers forward-looking insights about consumer spending and the economic growth dependent upon it.
The average American household has more than two-thirds of its overall wealth in financial assets such as savings accounts, stocks, and pension plans and about one-third in nonfinancial assets such as real estate.
A particular subset of financial assets is collectively referred to as liquid wealth because it can more quickly and easily fund household spending. Liquid wealth includes cash, checking and savings deposits, and money market funds. Liquid asset classes make up about 10% of overall wealth for households across the income distribution.
The bottom 80% of households hold only half as much liquid wealth as the top 20%.
The recent drawdown in liquid assets has coincided with an increase in household debt, which has been steadily increasing over the past few years—and recently reached all-time highs (Household Debt and Credit Report by the Federal Reserve Bank of New York (2024).
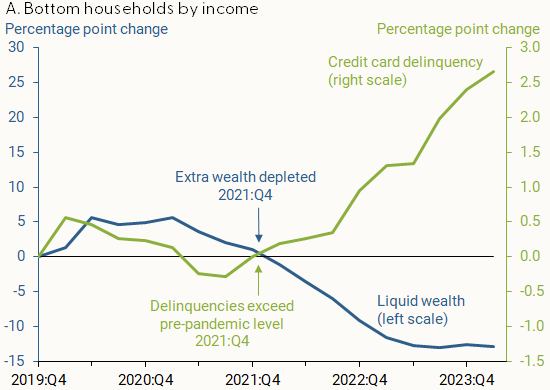
The first chart below incorporates data on delinquency rates for borrowers living in low-to-middle-income neighbourhoods from the Federal Reserve Bank of New York’s Equifax Consumer Credit Panel. Here, we see that excess savings accumulated during the pandemic were consumed by the 4th quarter of 2021 (blue line below, since Q4 2019), about the same time that credit card delinquencies (in green) leapt above pre-pandemic levels. Both wealth indicators have been steadily deteriorating since.
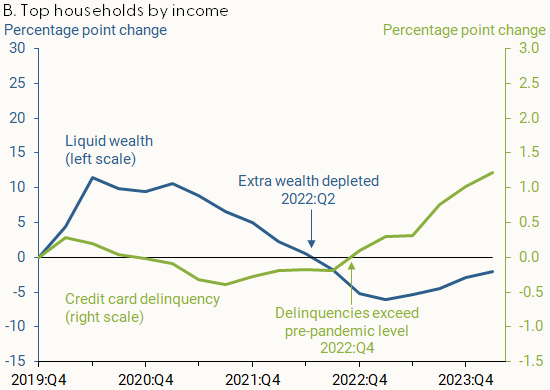
The second chart below shows that for high-income income households, excess savings lasted another six months before finally evaporating in the second quarter of 2022 (blue line below), with credit card delinquencies surpassing pre-COVID levels by the final quarter of 2022.
With US economic growth some 70% dependent on consumer spending growth, here is the San Fran Fed’s conclusion:
Depleted household liquid wealth was accompanied by a notable increase in credit card delinquency rates, particularly for middle- and lower-income households. Smaller financial cushions and heightened credit stress for households at the bottom 80% of the income distribution pose a risk to future consumer spending growth.
More By This Author:
Canada’s Financial Hell Paved With Good IntentionsInflated Prices Increasingly Weigh
The Real Estate Cliff Could Break Everything

Comments
Log in or sign up to join the conversation.