Pairs In Focus This Week - Sunday, Sept. 7
Image Source: Unsplash
USD/CHF
(Click on image to enlarge)
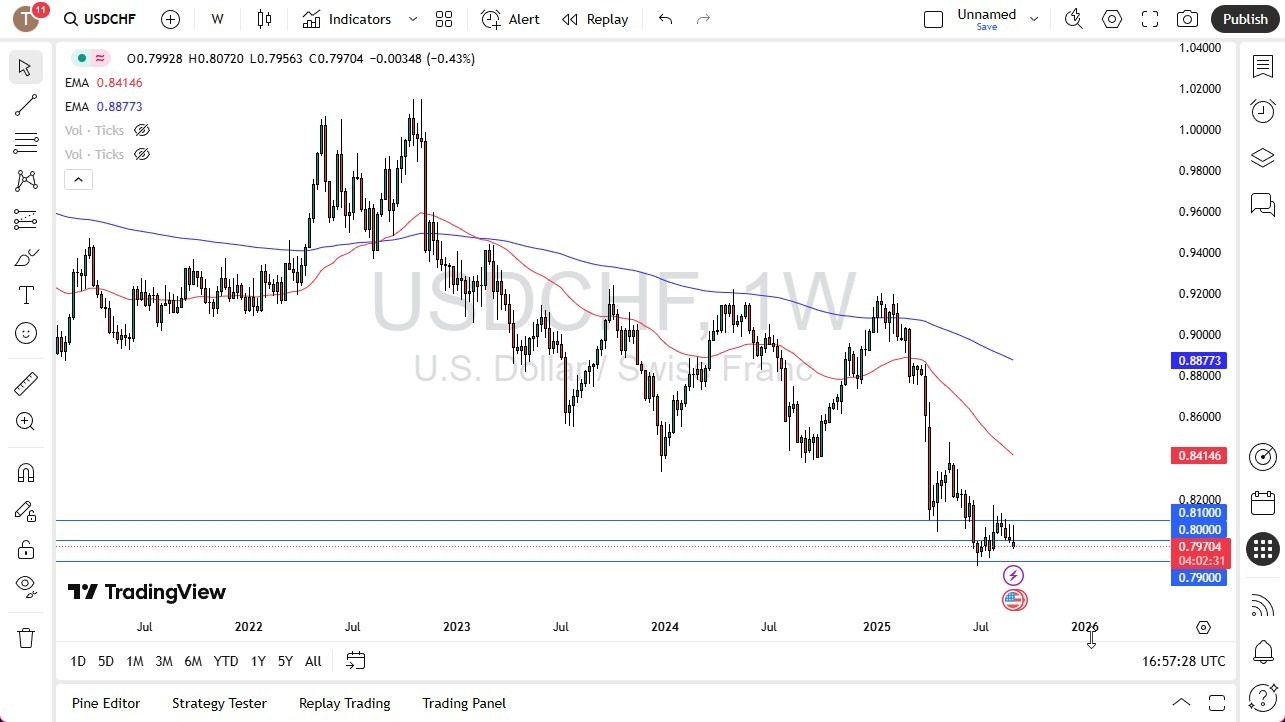
The US dollar initially rallied during the trading week, before it formed a long tail formation to the upside for the third week in a row. Ultimately, this market looks as though it may drop down toward the 0.79 level. Whether or not it can hold onto that level remains to be seen, but it does seem likely that the Swiss franc could continue to strengthen. I believe any rallies that may occur would probably continue to be sold into.
BTC/USD
(Click on image to enlarge)
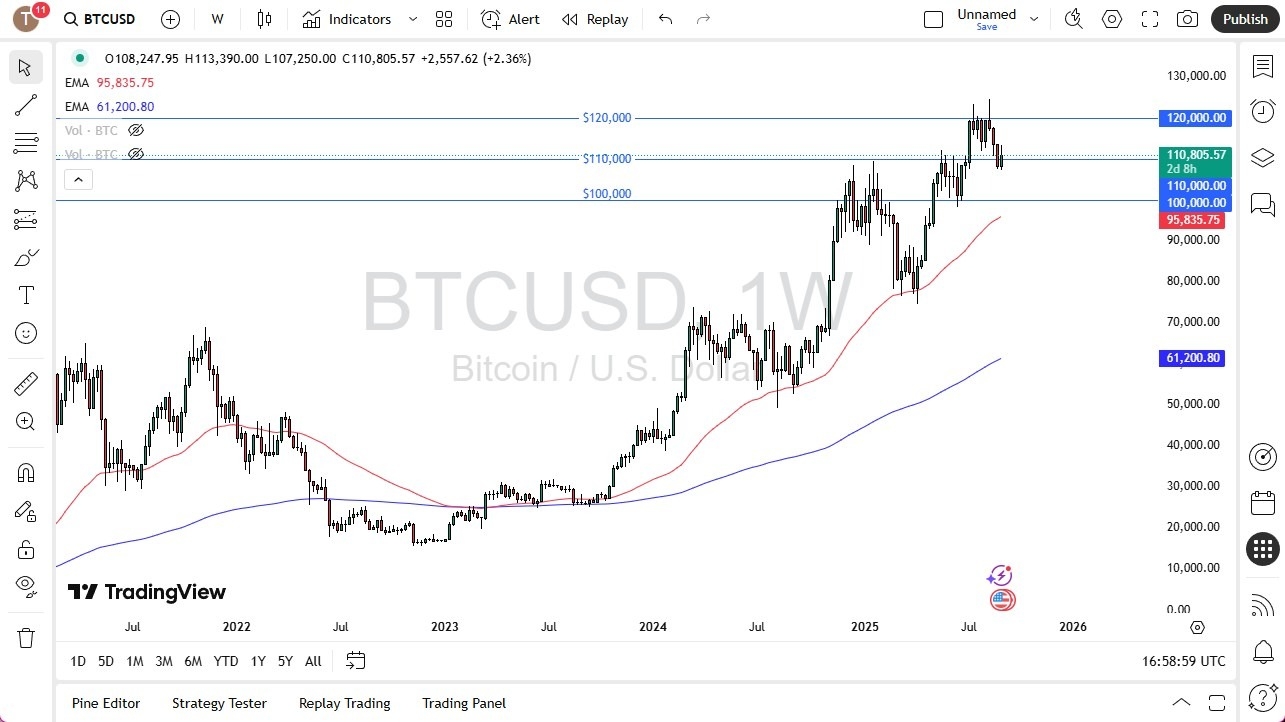
Bitcoin appears ready to finish the week with a green candlestick, but, quite frankly, Friday's candlestick structure does not look very appealing. The $110,000 level is an area of interest, and the cryptocurrency seems to be trying to hang on to the previous resistance barrier as support.
If it can break down below the bottom of the candlestick for the week, then it would be possible to see Bitcoin drop down to the $100,000 level. That being said, it should be kept in mind that Bitcoin is highly sensitive to risk appetite. Thus, if we continue to see more fear in the markets, Bitcoin will not do well.
Gold
(Click on image to enlarge)
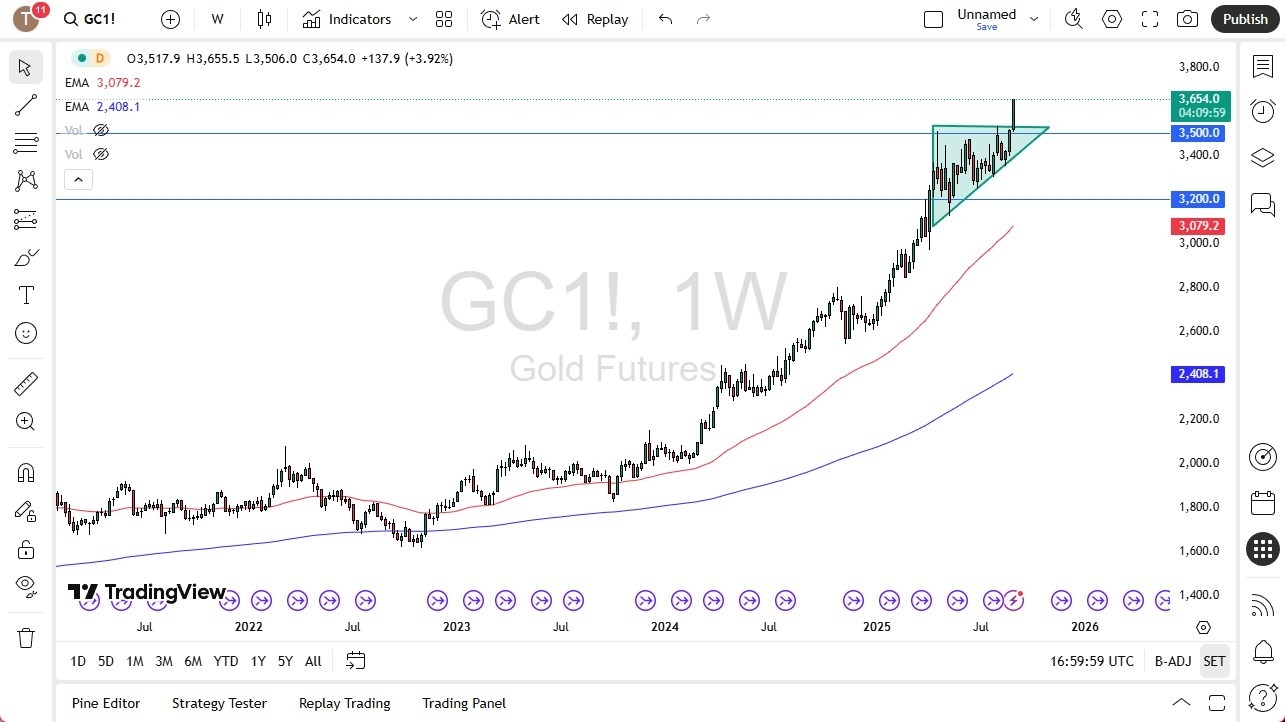
Gold rallied rather significantly over the past week due to the Non-Farm Payroll announcement that shocked the market. Quite frankly, the yellow metal has blown through the $3500 level, and it looks like it could continue to go much higher.
Based on its “measured move”, it’s possible that the gold market could go looking to reach the $3800 level. The size of the candlestick is very impressive, and any pullback at this point in time should see a lot of support near the $3500 level.
Silver
(Click on image to enlarge)
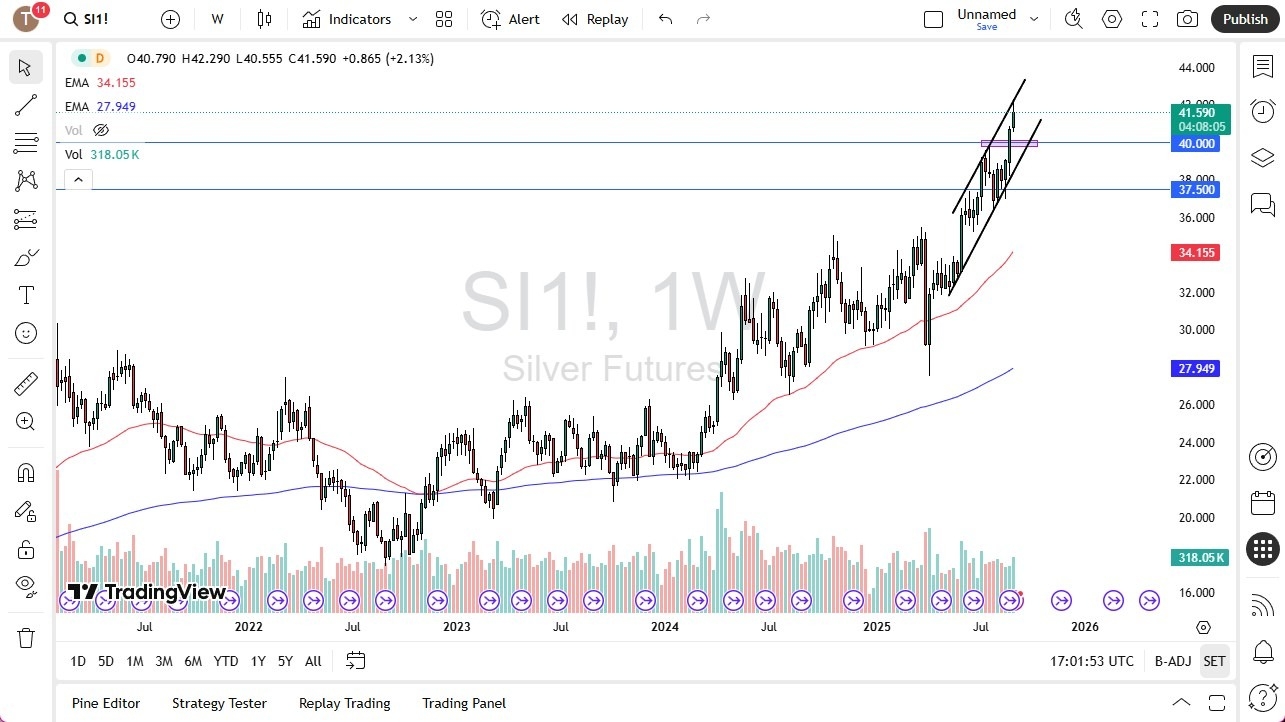
Silver rallied rather significantly during the course of the trading week as it came to test the crucial $42 level. The grey metal seems to be a little overbought at this point. The US dollar might take a bit of a beating in the short-term, and such a scenario could see silver come out on top.
Pullbacks at this point in time should look at the $40 level underneath as significant support, so it’ll be interesting to see whether or not it holds. If it continues to go higher and break above the $42 level, then the space could see an impulsive move even higher.
EUR/USD
(Click on image to enlarge)
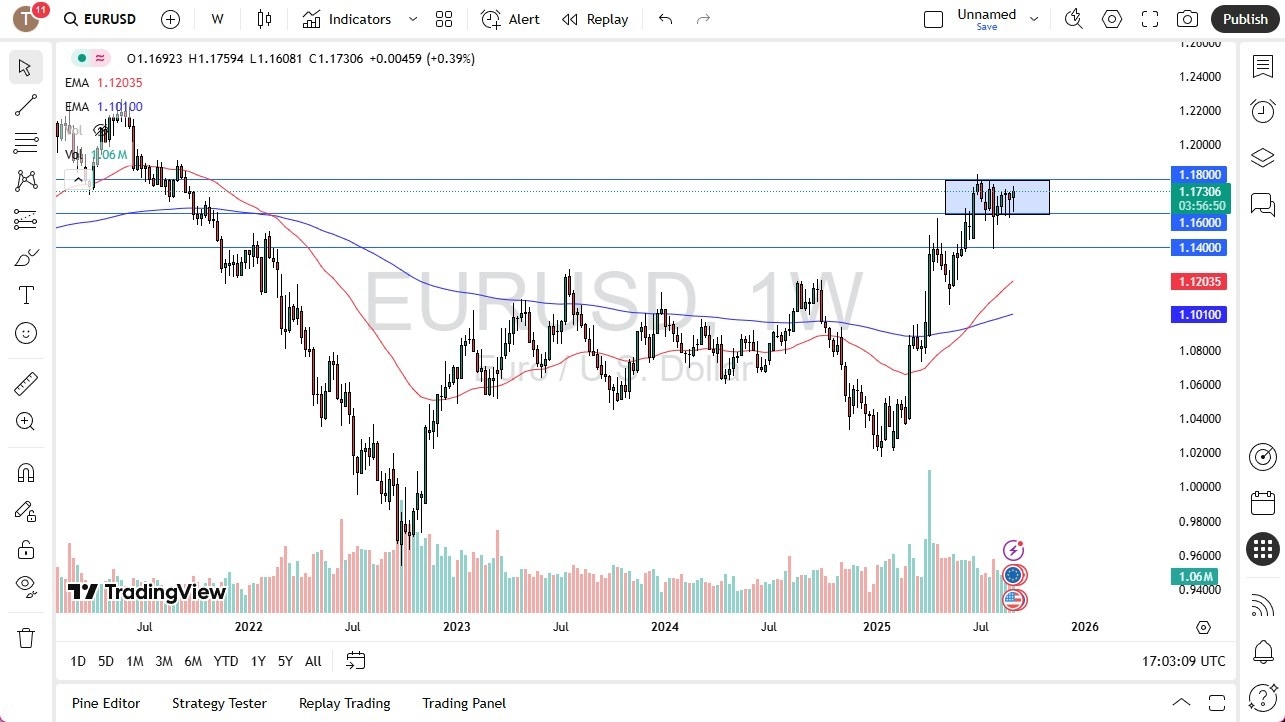
The euro fell during the course of the trading week as it came to test the 1.16 level. However, the jobs number was so poor in the United States that it sparked a shot to the upside. It looks as though traders are trying to do everything they can to rally at this point.
That being said, the currency pair is still very much in the same consolidation area that it had been in previously, so if it were to break down below the 1.16 level, it would be an extraordinarily negative turn of events. If it can break above the 1.18 level, then the pair could go looking to the 1.20 level.
GBP/USD
(Click on image to enlarge)
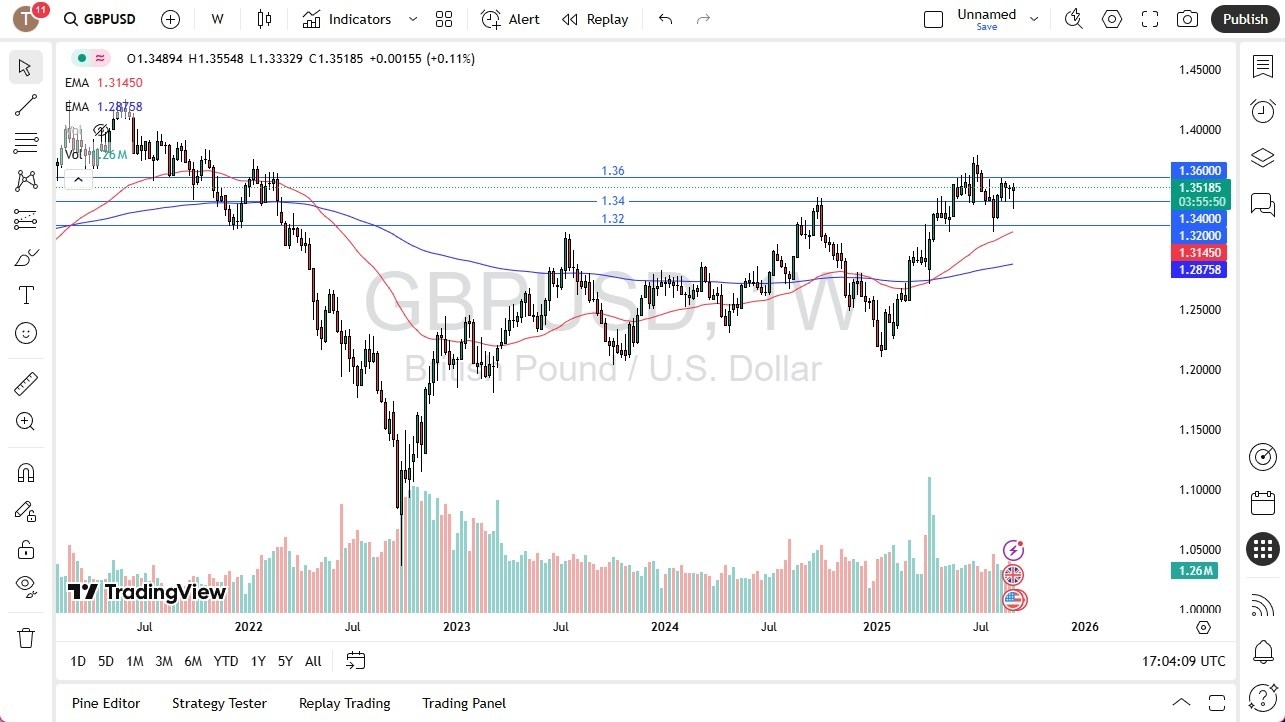
The British pound looked as if it was in serious trouble earlier in the week, but it has since rallied quite significantly from underneath the crucial 1.34 level. The resulting hammer formation is a good sign for the British pound, perhaps signaling that the currency is trying to get back to the 1.36 level.
If it can break above the 1.36 level, then the market could go looking toward the 1.38 level after that. Short-term pullbacks could end up being buying opportunities, but if we see a break down below the low of the previous week at 1.3350, then the British pound could find itself in further trouble in more of a “risk-off” type of scenario.
Nasdaq 100
(Click on image to enlarge)
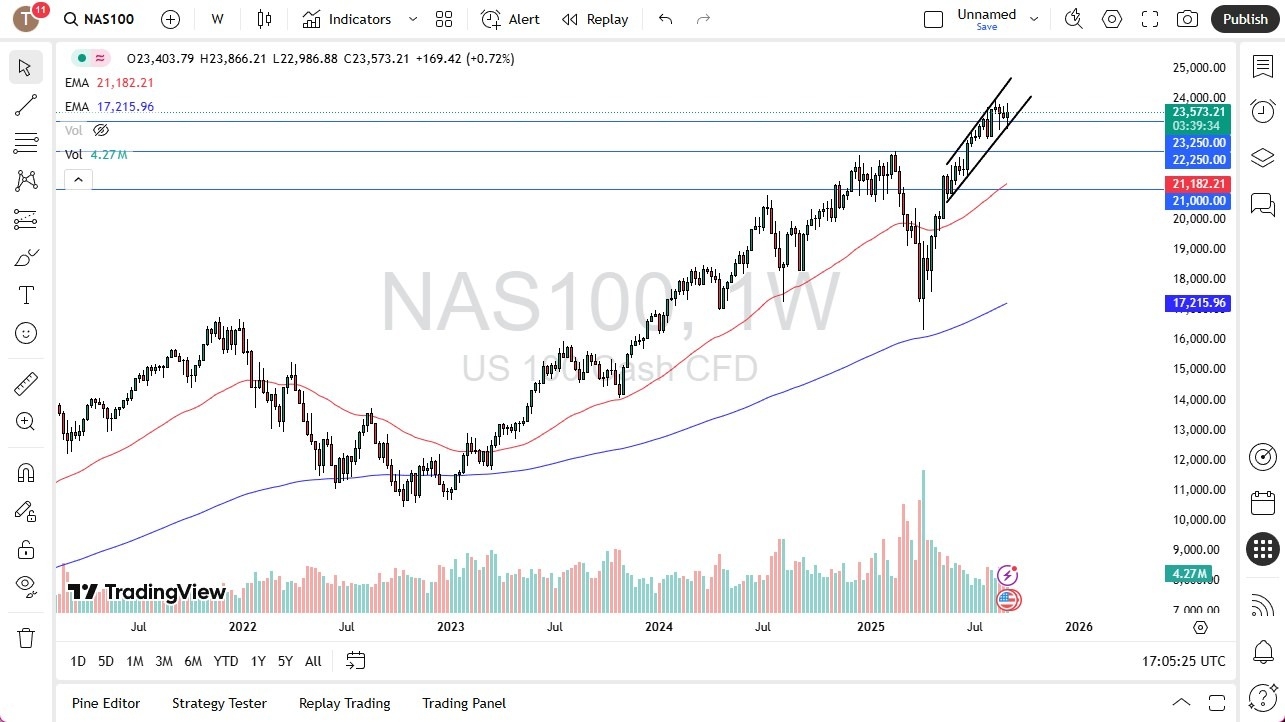
The Nasdaq 100 moved all over the place during the week, as you would expect, due to all of the economic events and factors seen this past trading period. The jobs number, of course, was the biggest driver of where it went, but it looks as if the index is still very much on the same uptrending channel that it had been in previously.
If it can break above the 24,000 level, then the Nasdaq 100 could really start to take off. On the other hand, if it breaks down below the 23,500 level, that would be a very negative turn of events for Nasdaq 100.
USD/MXN
(Click on image to enlarge)
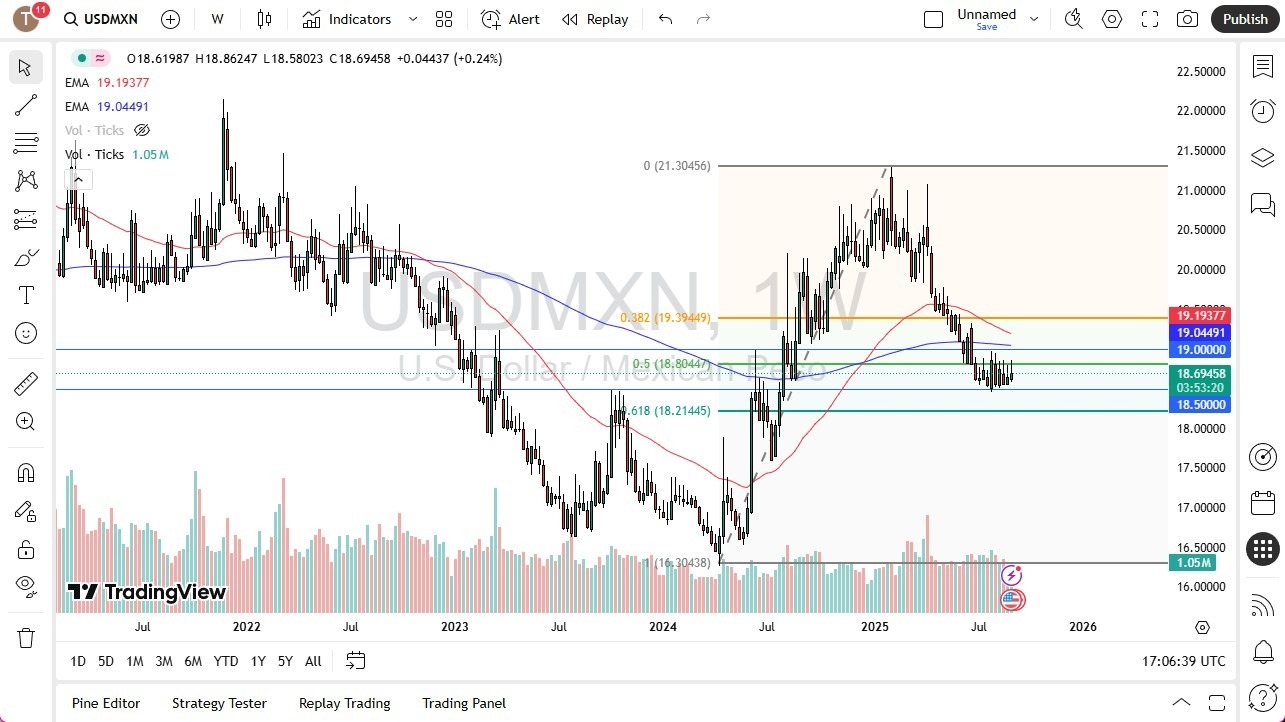
The US dollar witnessed a lot of noise against the Mexican peso, as the market has been trying to digest what’s going on with the US economy. With the jobs numbers coming out as weak as they did, the data could cause some issues for the Mexican economy due to the country's status as the biggest exporter to the United States and the world.
In other words, if the US economy starts to crumble, that would be a major problem for the Mexican economy. However, if the currency pair were to break down below the 18.50 level, then I think it could go looking to the 18.00 level. Rallies at this point in time would need to break above the 200-day EMA near the 19.0449 level to make me even remotely bullish.
More By This Author:
GBP/USD Forecast: Holds SteadyBTC/USD Forecast: Looking For Support
EUR/GBP Forecast: Pulls Back – Range-Bound Between Key Levels
Disclosure: DailyForex will not be held liable for any loss or damage resulting from reliance on the information contained within this website including market news, analysis, trading signals ...
more

