Pairs In Focus This Week - Sunday, May 12

Image Source: Pixabay
USD/MXN
(Click on image to enlarge)
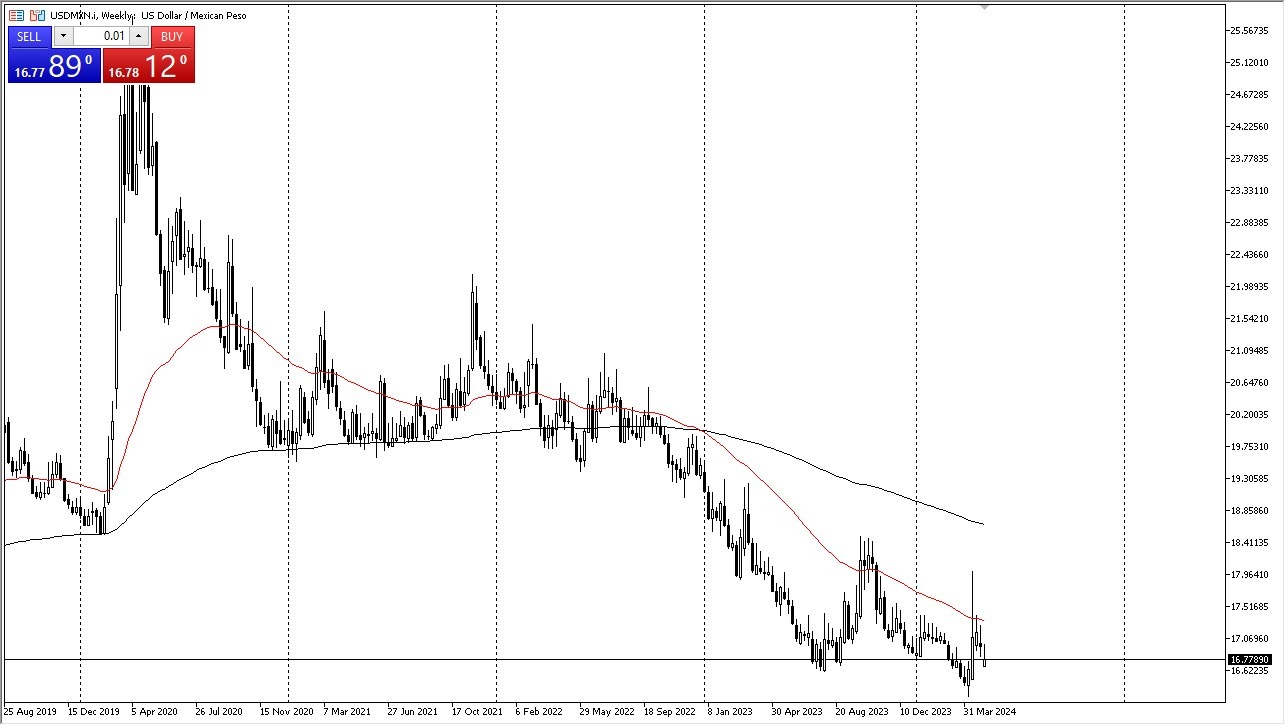
The US dollar gapped lower against the Mexican peso to kick off the trading week, only to turn around, show signs of strength, and fill that gap. However, it then turned around again and started selling off.
I believe the market has been attempting to break down below the 16 pesos level, but it still has a long way to go. In general, this will be an interesting pair to watch due to the fact that it is an emerging market currency that is extraordinarily important. I think this still remains a market that one could look to fade rallies in.
EUR/JPY
(Click on image to enlarge)
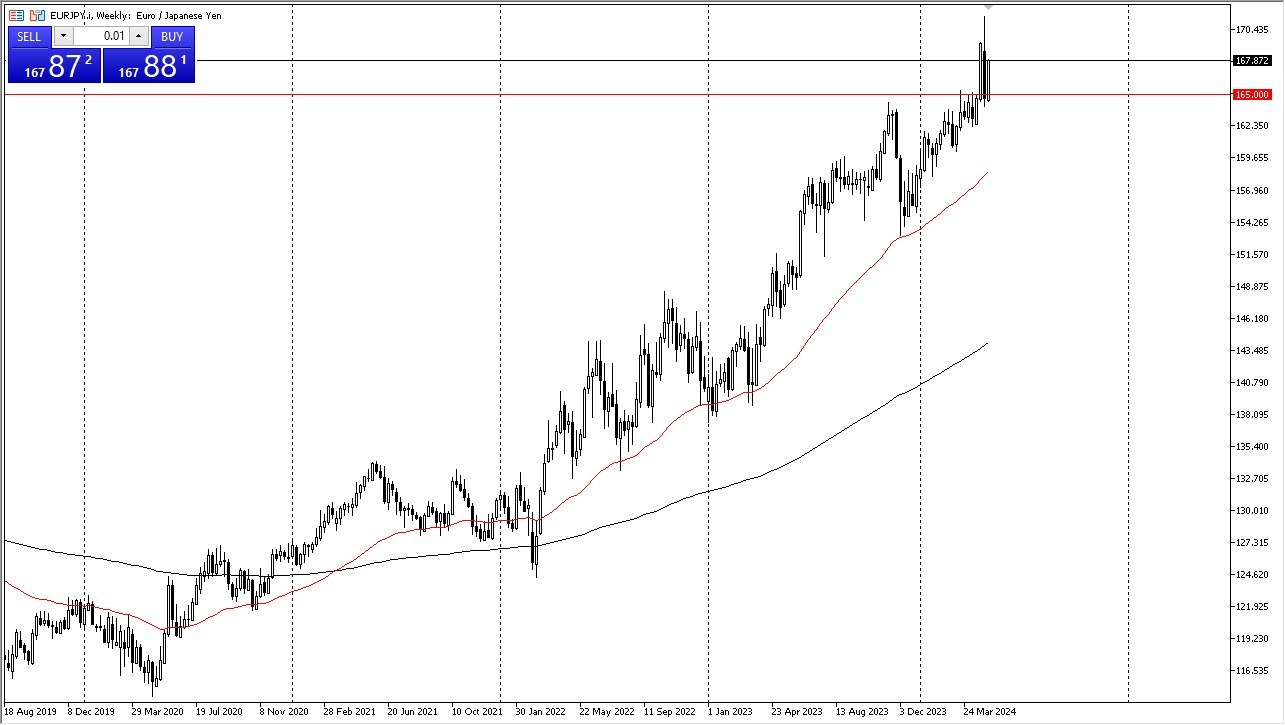
The euro rallied rather significantly against the Japanese yen during the trading week, as it successfully defended the JPY165 level. The market looks as though it is readying to attack the JPY170 level, which is a large, round, psychologically significant figure. If we do see a pull back from here, I suspect that there will be plenty of buyers willing to come in and pick this market up based upon the idea that it will become “an offering of cheap euros.”
CAC
(Click on image to enlarge)
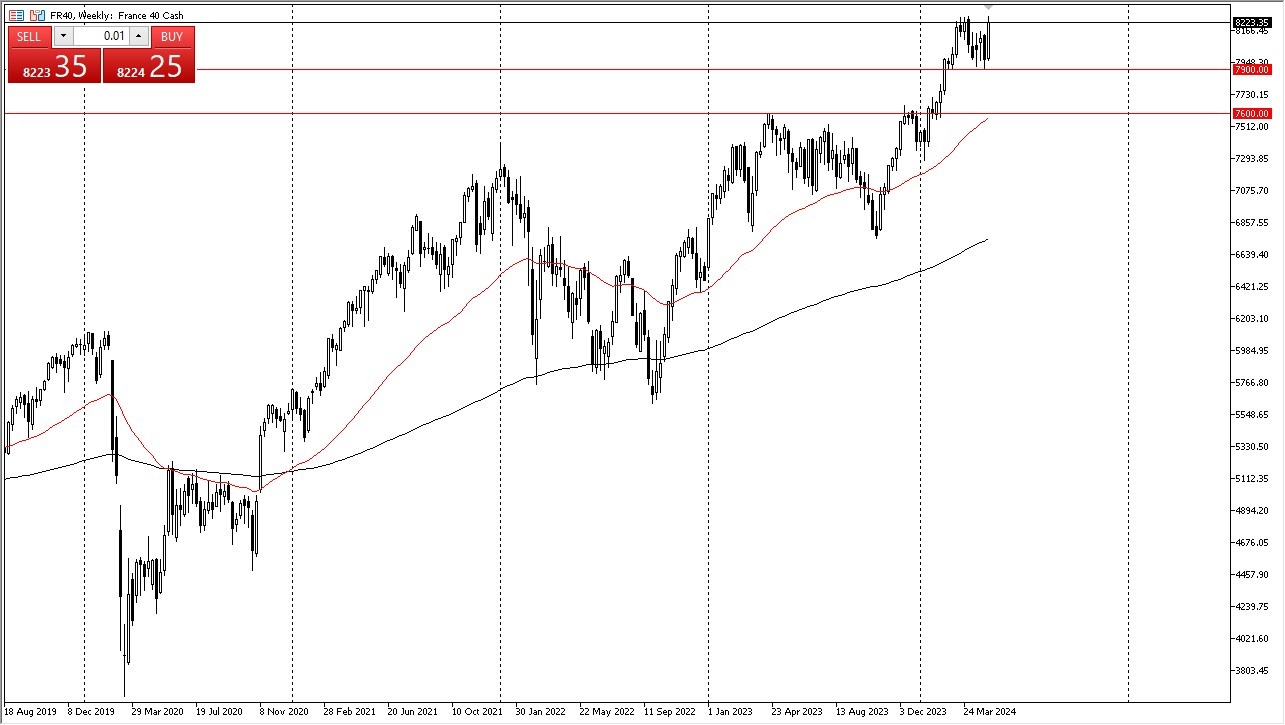
The French index witnessed a very positive week, although it’s worth noting that Friday saw a little bit of a letdown. The market struggled at the previous high, but this simply means that it will probably pull back to find more buyers. Underneath, we can see that the EUR7900 level is likely to offer quite a bit of support. Even if we see a break down below there, I think there would be even more support near the EUR7600 level as the 50-week EMA comes into the picture.
GBP/JPY
(Click on image to enlarge)
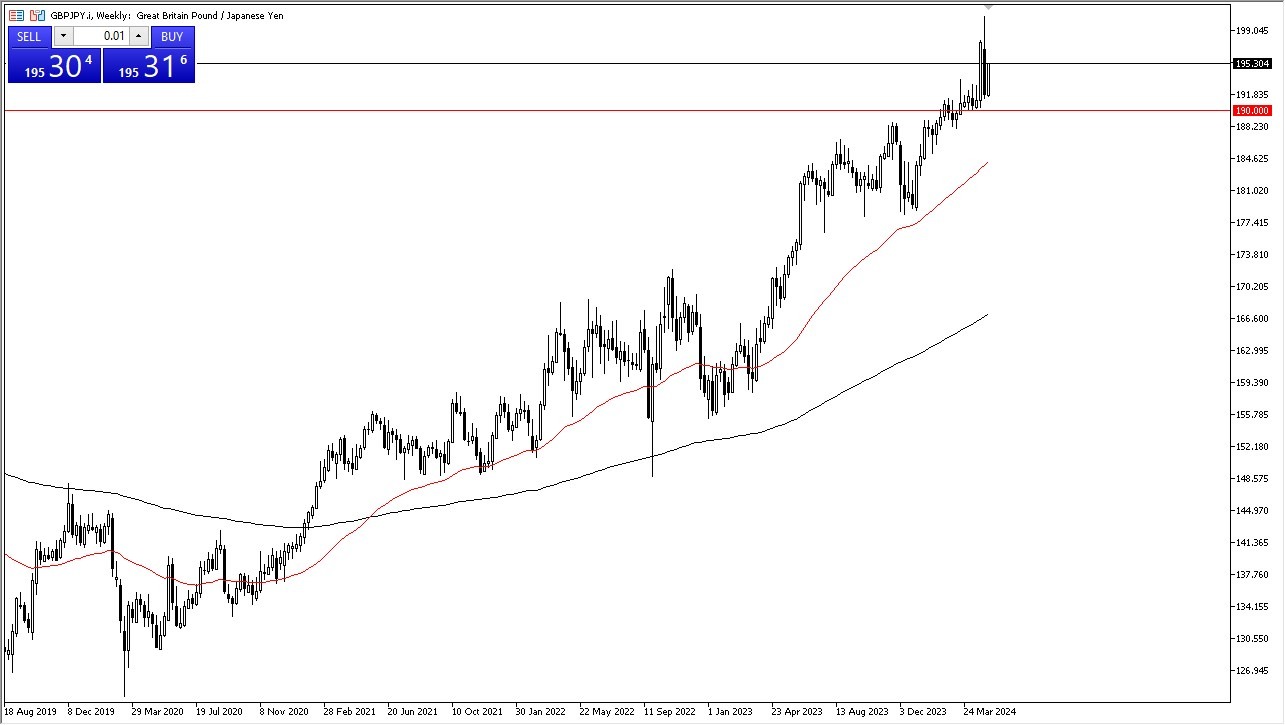
The British pound rallied significantly during the course of the week, much like the euro, against the Japanese yen. It broke back above the JPY195 level, which is a victory for the bulls.
I believe that anytime this pair pulls back, one should start thinking about the idea of buying the dip for value. I personally have no interest in buying the Japanese yen, as the interest rate differential will continue to be the main driver of all of the Japanese yen denominated currency pairs.
GBP/CHF
(Click on image to enlarge)
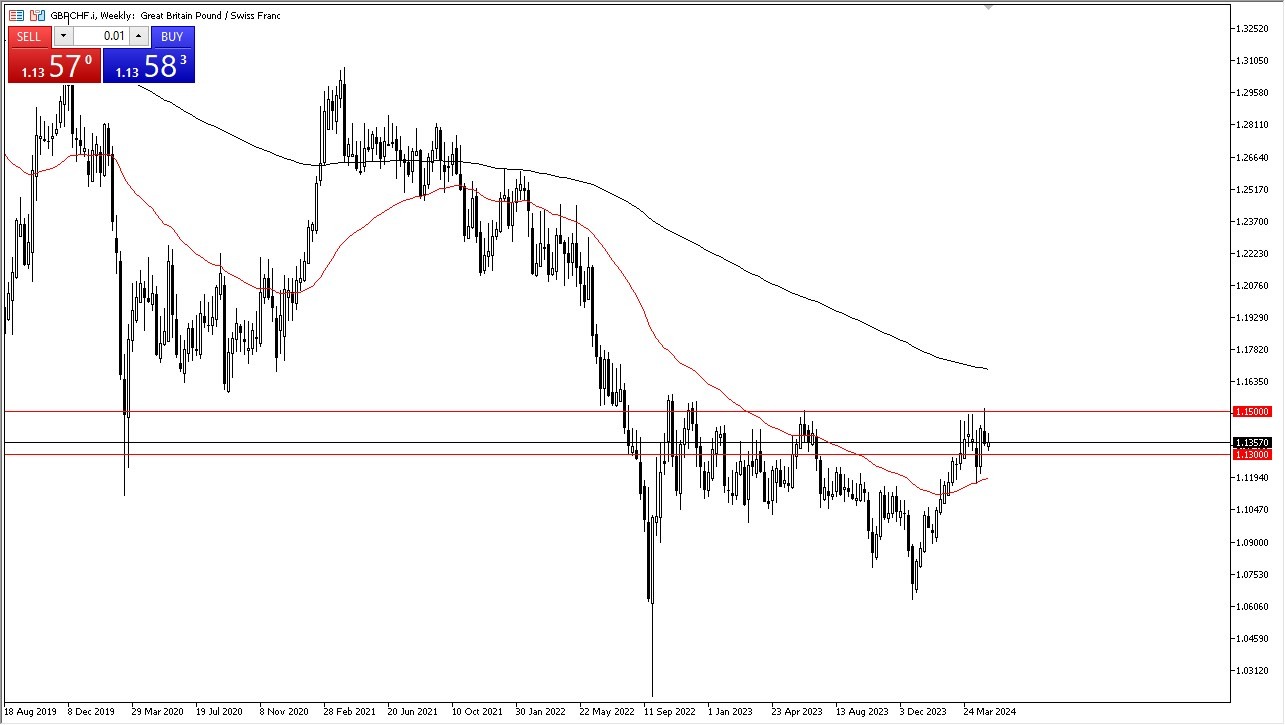
The British pound initially rallied against the Swiss franc, but it gave back those gains as it witnessed a little bit of weakness. That being said, part of this could have something to do with the fact that 2 of the members of the Monetary Policy Committee voted to cut rates this week. On the other side of the equation, we also have the Swiss National Bank who has already cut rates, so this could be a very volatile pair.
However, if we were to see a break above the 1.15 level, that could send this market much higher. Short-term pullbacks should continue to see plenty of support near the 1.13 level, possibly even down at the 50-week EMA at the 1.12 level.
EUR/GBP
(Click on image to enlarge)
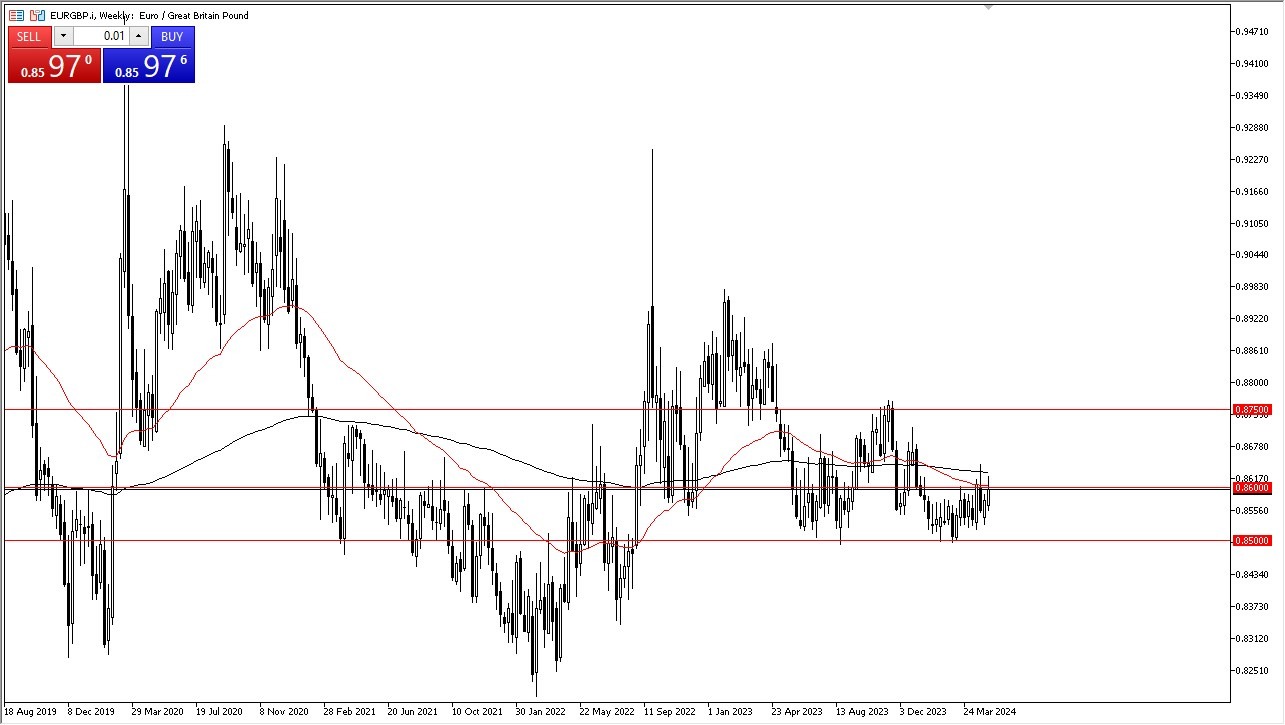
The euro rallied significantly to break above the 0.86 level. However, just as what was seen in the British pound against the Swiss franc, there was a little bit of concern that a couple of the MPC members have decided to vote for an interest rate cut.
However, the European Central Bank is almost certainly going to be cutting rates in the next month or two, so I think we will still see plenty of pressure to the upside. Additionally, I think that short-term pullbacks will continue to turn things around and show an opportunity to get long yet again.
US Oil
(Click on image to enlarge)
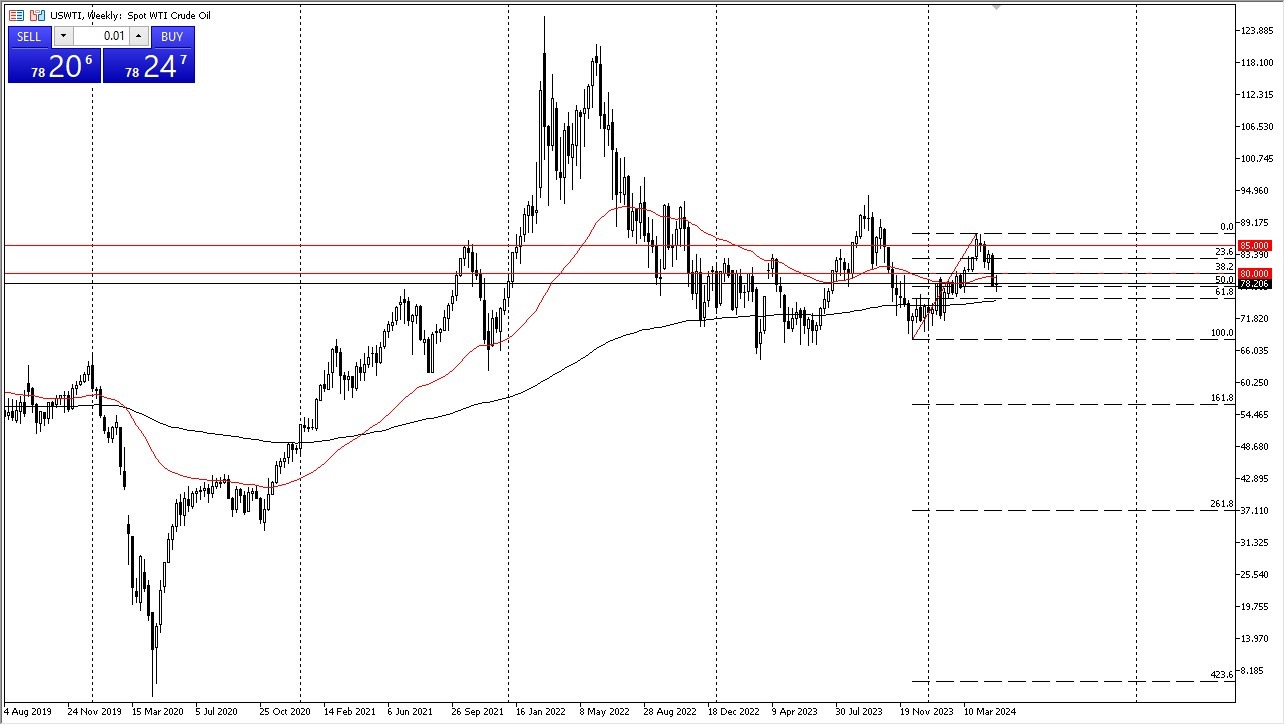
The crude oil market moved back and forth during the course of the week, as it continued to struggle with the idea of breaking above the $80 level. If and when we see it do so, it’s likely that the market could then go looking to the $83 level.
It’s worth noting that the 50% Fibonacci level has offered a bit of support, and therefore I think this space will continue to see a lot of volatility. However, I also think there are plenty of value hunters out there willing to get involved.
Gold
(Click on image to enlarge)
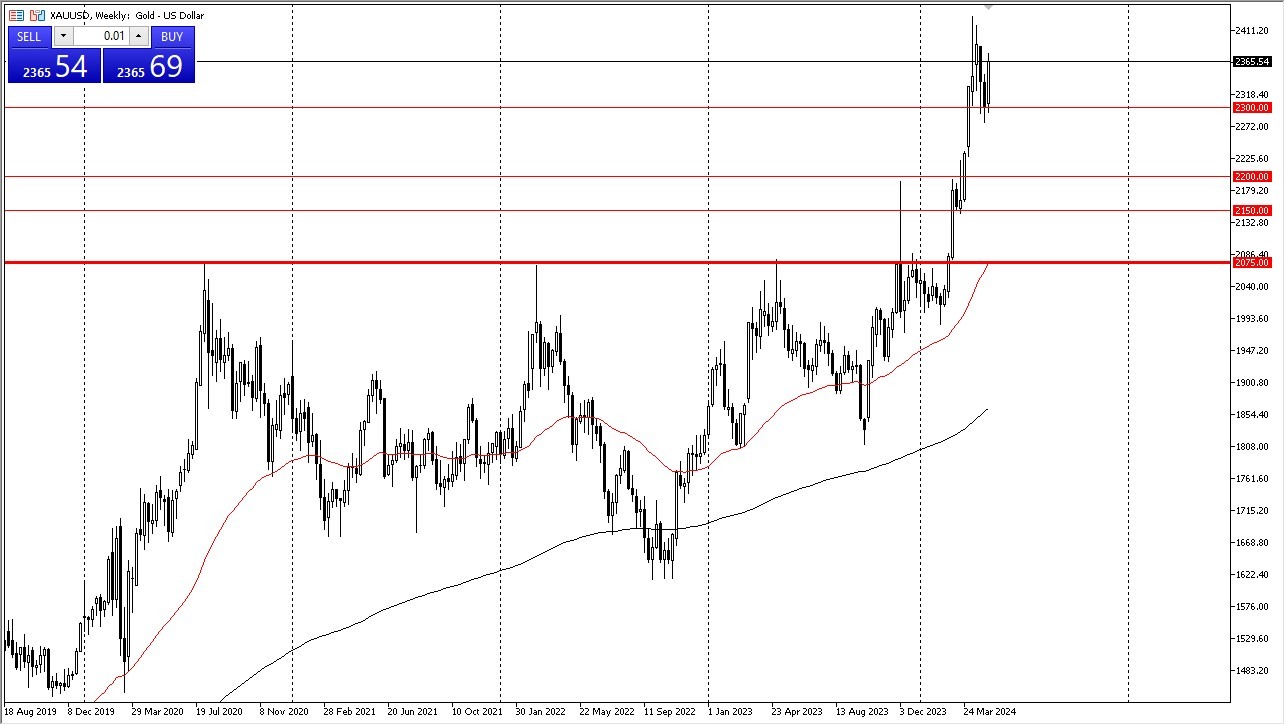
Gold rallied rather significantly during the trading week, but some cracks started to show on Friday. I think this space will continue to see more of a “buy on the dip” approach, with the $2300 level underneath likely to offer major support. If it can break above the $2400 level, then it’s possible that gold could make a move toward the $2500 level above, which is my intermediate target.
More By This Author:
DAX Forecast: Powers Higher To Reach New HighsGBP/JPY Forecast: British Pound Continues To Rally Against Yen Despite Bank Of England
GBP/CHF Forecast: British Pound Continues To Look for Support Against Swiss Franc
Disclaimer: DailyForex will not be held liable for any loss or damage resulting from reliance on the information contained within this website including market news, analysis, trading signals and ...
more
