Pairs In Focus This Week - Sunday, Feb. 11
Image Source: Unsplash
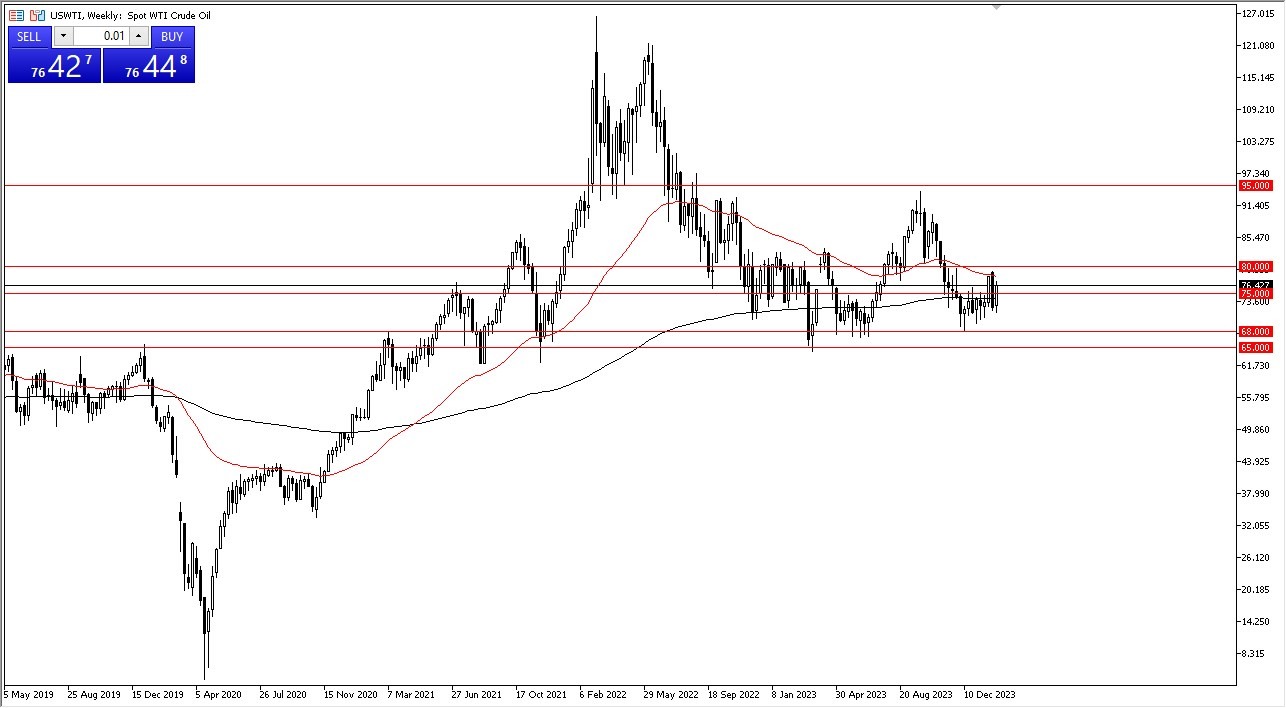
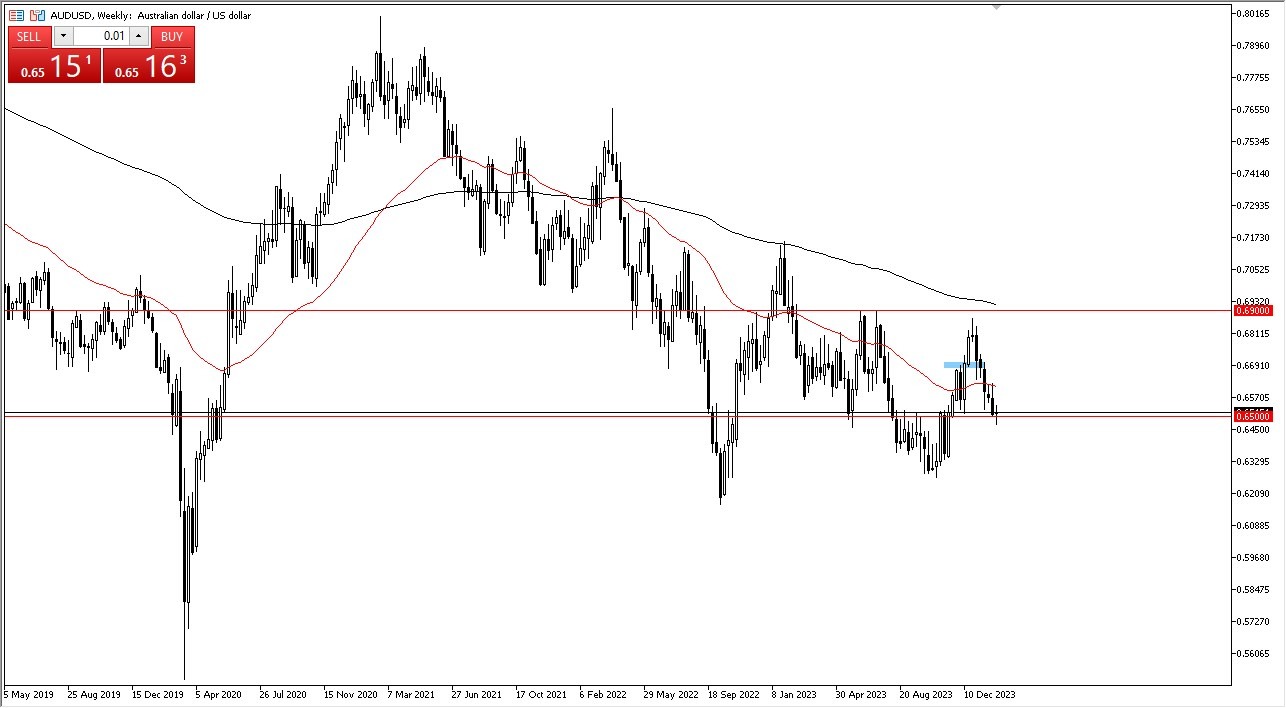
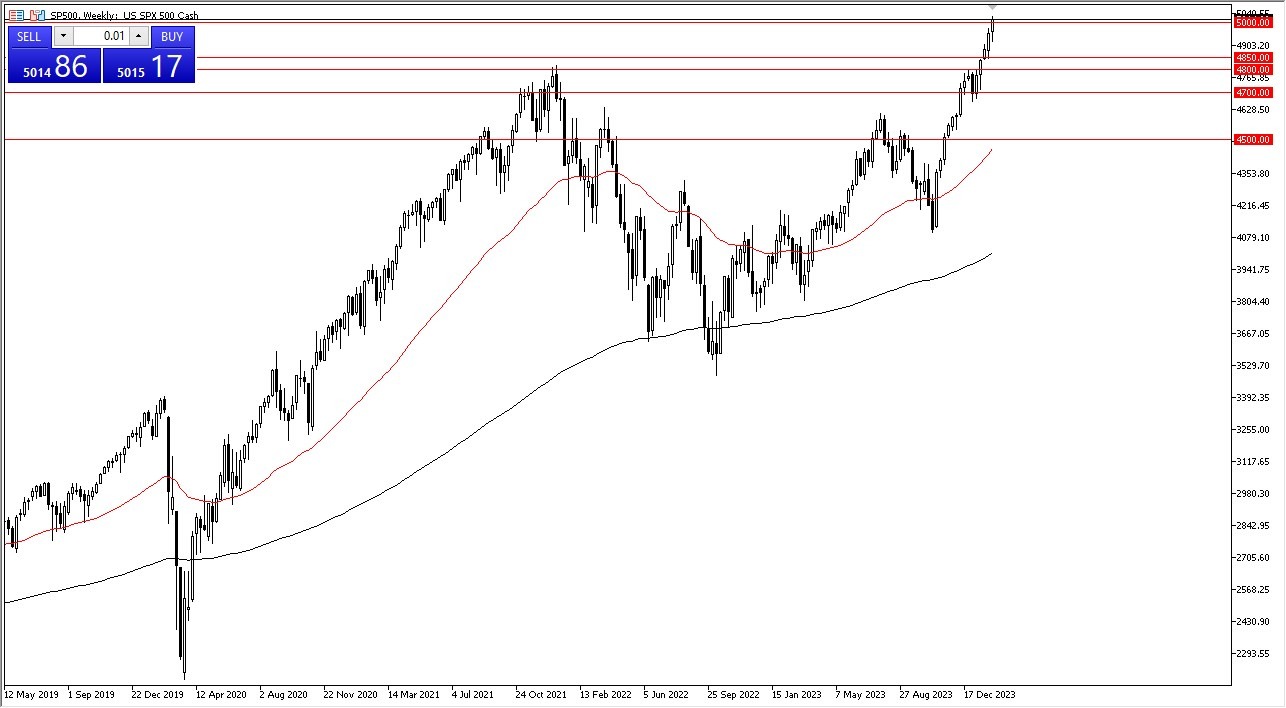
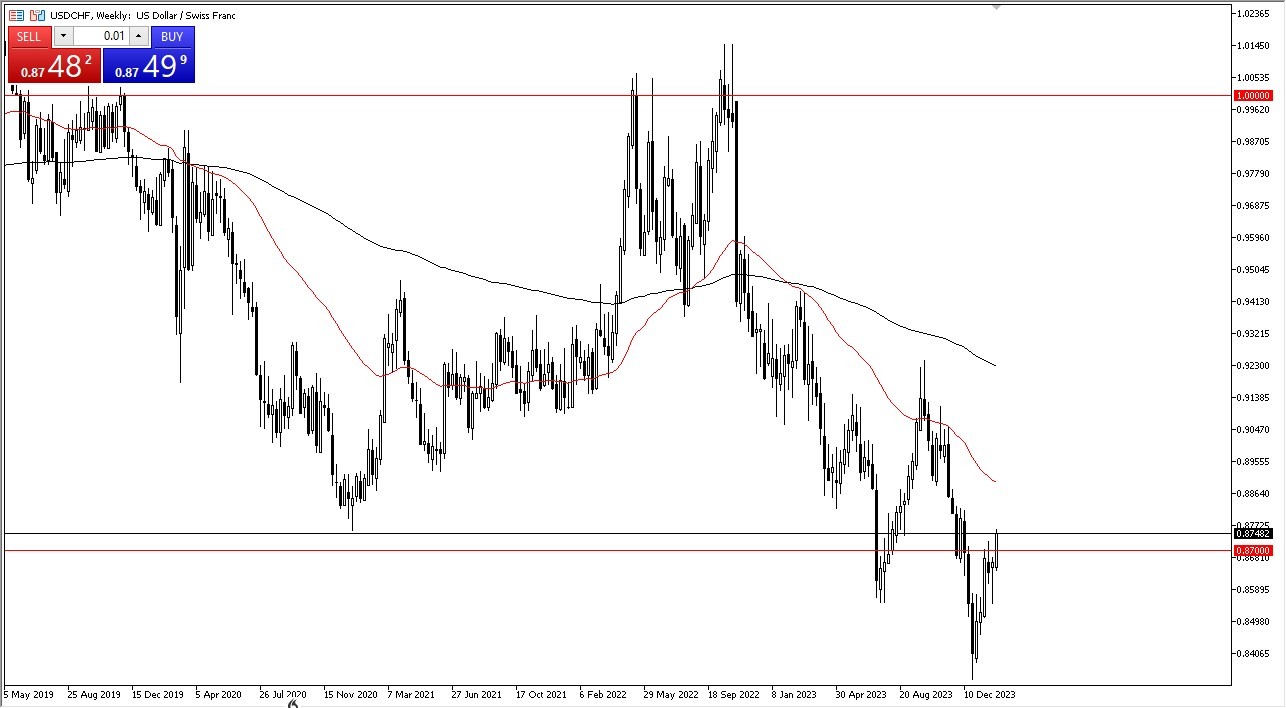
WTI crude oil recently eyed the $80 level. The AUD/USD currency pair appeared ready to reach the 0.69 mark. The S&P 500 remained strong past the 5000 level. The USD/CHF pair aimed for the 50-week EMA, while the EUR/USD duo looked ready to test the 1.10 level. The GBP/CHF pair and the Nikkei 225 showed bullish signs.
WTI Crude Oil
(Click on image to enlarge)
The crude oil market rallied significantly during the course of the week, before breaking above the crucial $75 level. By doing so, it appears likely to continue going higher in the coming week, perhaps reaching the crucial $80 level. Short-term pullbacks may continue to be buying opportunities, especially near the $70 level. This area is a large, round, psychologically significant figure that will likely continue to attract a lot of attention.
AUD/USD
(Click on image to enlarge)
The Australian dollar initially plunged below the 0.65 level during the course of the week, but it turned around to hang onto it. The market may likely rally from here and go looking to the 50-week EMA, or perhaps even as high as the 0.69 level. On the other hand, if it were to break down below the bottom of the candlestick, then the market could drop down to the 0.63 level. It is crucial to remember that the Australian dollar is highly sensitive to risk appetite.
S&P 500
(Click on image to enlarge)
The S&P 500 initially dipped a bit during the course of the week, only to turn around and show signs of strength again. As it was seen breaking above the 5000 level, many people may be looking to go long, perhaps based on the fear of missing out.
Any short-term pullbacks could serve as buying opportunities, and I believe that the 4850 level is going to continue to be a major floor in the market. The index appears to be overextended at the moment, but that has been the case over the last few months.
USD/CHF
(Click on image to enlarge)
The US dollar rallied significantly against the Swiss franc, breaking above the 0.87 level. The US dollar may be ready to continue going higher, perhaps reaching toward the 50-week EMA.
The market pulling back from here would make quite a bit of sense. On the other hand, if it were to break down below the candlestick from the previous week, then the market could go down to the 0.84 level.
USD/CAD
(Click on image to enlarge)
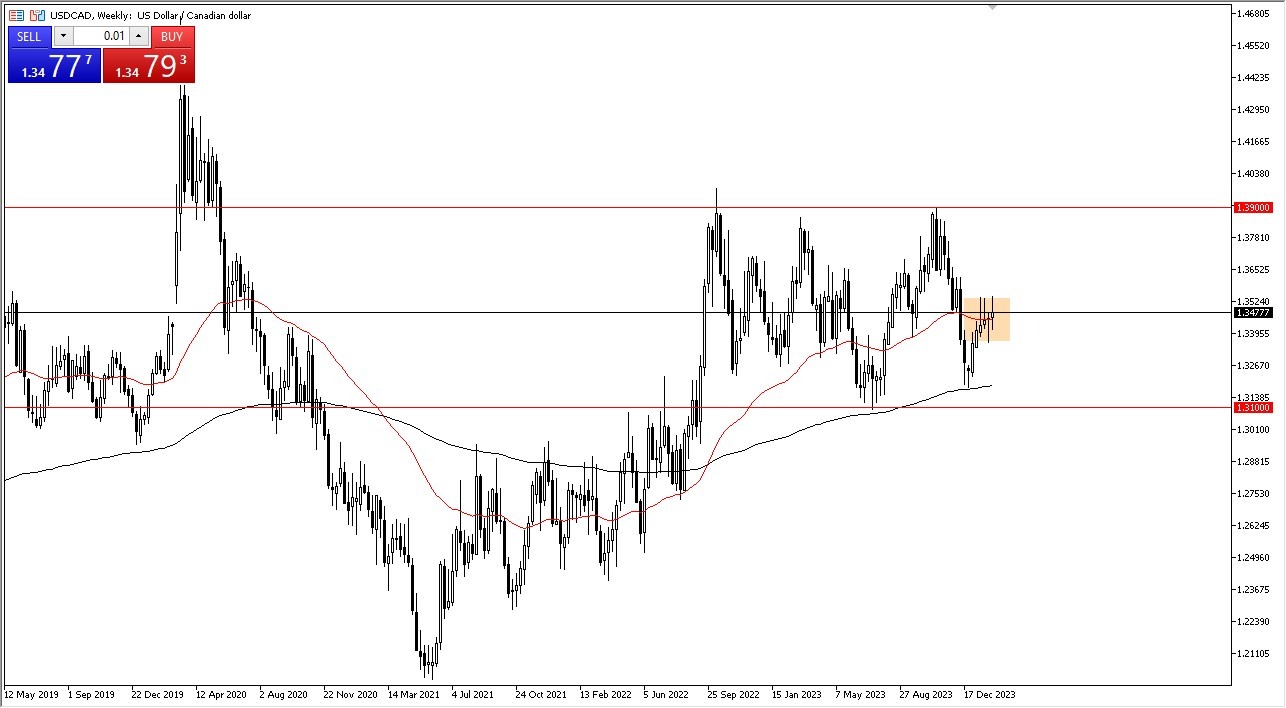
The US dollar moved all over the place against the Canadian dollar, as it continued to hang around the 50-week EMA. Ultimately, the 1.3550 level appears to be an area of short-term resistance, while the 1.3380 level underneath offers significant support. If and when a break out of this range occurs, the pair could move 100 pips in one direction or the other.
EUR/USD
(Click on image to enlarge)
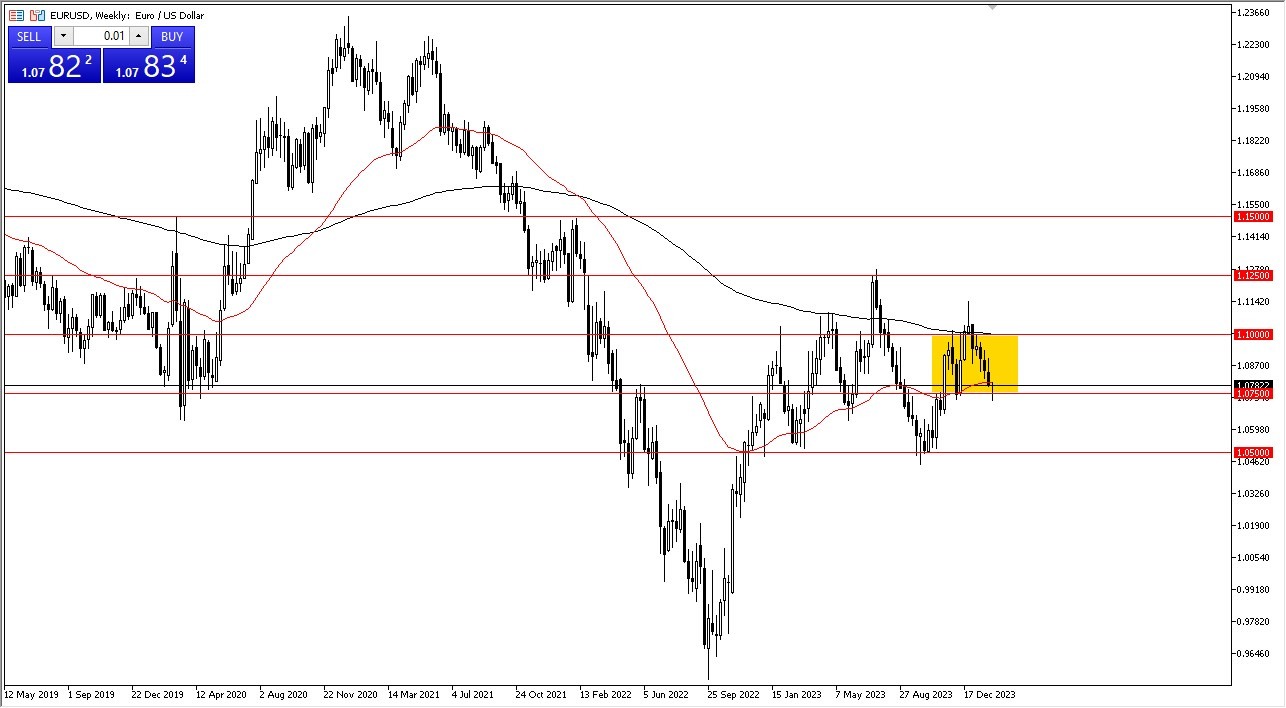
The euro initially fell during the course of the week to break down below the 1.0750 level. This is an area that has previously served as a resistance barrier.
It’s worth noting that the candlestick for the week is a hammer formation, so a break above the top of the 50-week EMA could see the euro go much higher, perhaps reaching the 1.10 level above. A break below this point could see the euro drop down to the 1.06 level, perhaps even to the 1.05 level where I see a massive amount of support.
GBP/CHF
(Click on image to enlarge)
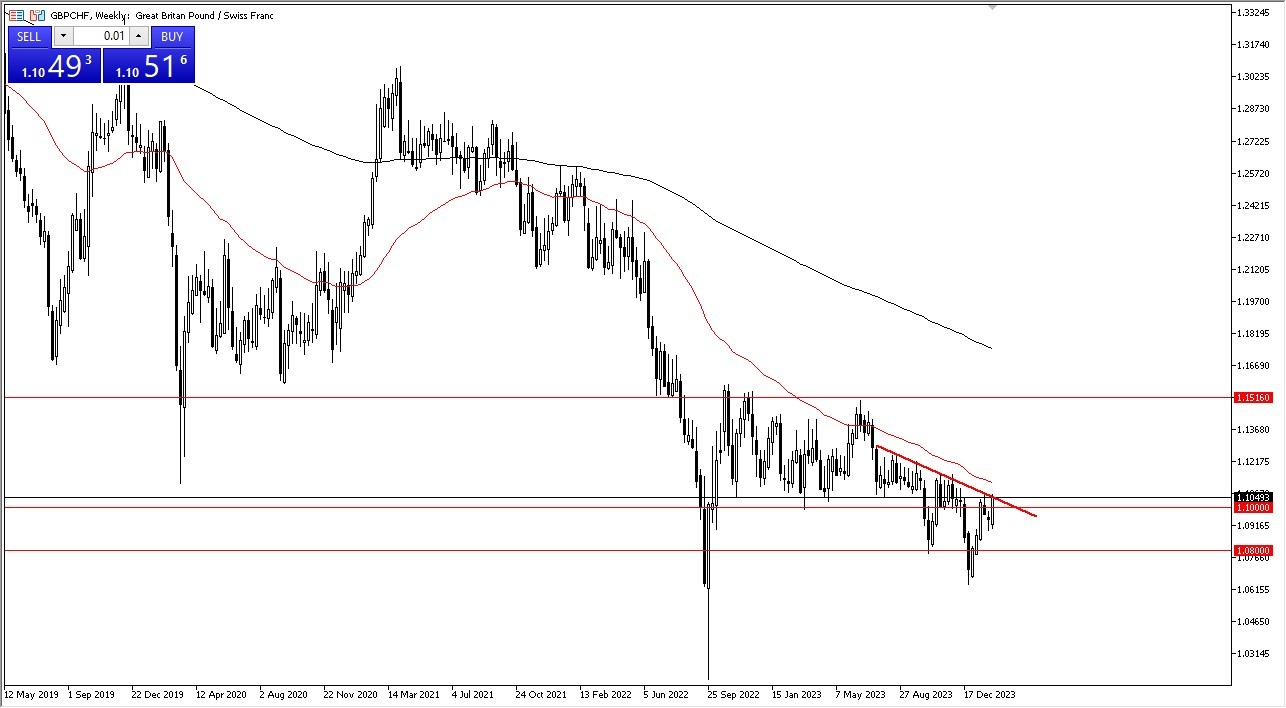
The British pound appeared to be testing a major downtrend line against the Swiss franc, as it closed near the very top of the weekly candlestick. At this point, the 50-week EMA may comes into the picture as well. A break above there would likely cause the market to go looking to the 1.15 level over the longer-term.
On the other hand, a fall from here could see the market go down to the 1.09 level as support. Keep in mind that the interest-rate differential continues to favor the British pound, and we have seen quite a bit of weakness in the Swiss franc against multiple currencies.
Nikkei 225
(Click on image to enlarge)
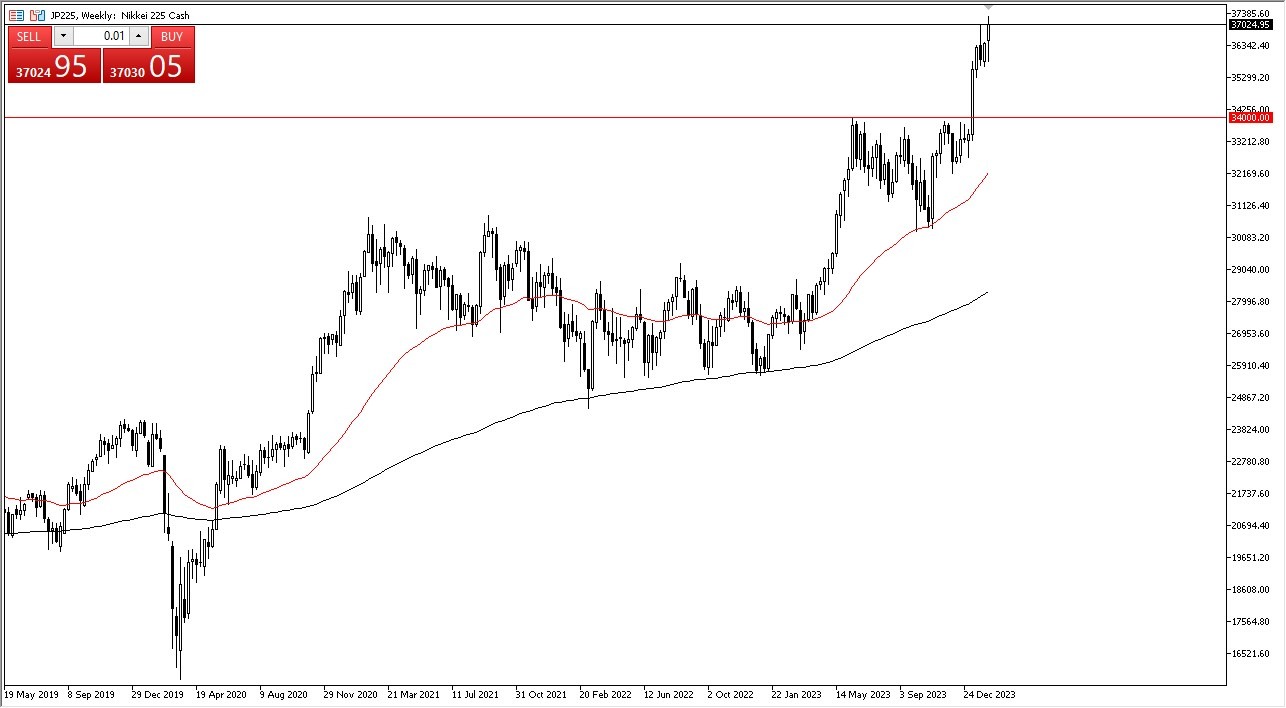
The Nikkei 225 pulled back just a bit during the course of the trading week to test the JPY36,000 level. Short-term pullbacks could serve as buying opportunities, and I do think that the Nikkei 225 could continue to go much higher.
In fact, it looks like the Nikkei 225 may be ready to go looking to the JPY38,000 level over the longer term. If it were to break down below the JPY36,000 level, then we could see quite a bit of selling pressure in that general vicinity. Overall, the Nikkei 225 continues to look very bullish.
More By This Author:
GBP/USD Forecast: British Pound Continues To ConsolidateBTC/USD Signal: Bitcoin Continues To Pressure The Upside
BTC/USD Forecast: Bitcoin Continues To Struggle For Momentum
Disclosure: DailyForex will not be held liable for any loss or damage resulting from reliance on the information contained within this website including market news, analysis, trading signals ...
more

