

Image Source: Unsplash
Dow Jones 30

(Click on image to enlarge)
The Dow Jones 30 plummeted rather hard during the course of the trading week. Now that we have seen such an ugly turn of events when it comes to the jobs number, it’s not a huge surprise that we continue to see more downward pressure.
However, there is a massive amount of support underneath that will eventually come back into the picture, as we have seen a strong uptrend line. I suspect that we see a little bit of follow-through, only for the market to turn right back around again as the Federal Reserve gets more aggressive with interest rate cuts.
Silver

(Click on image to enlarge)
Silver markets continued to be very noisy. The grey metal tried to rally during the week, but it collapsed as market sentiment turned negative. I think it’s probably only a matter of time before traders try to find a bit of value in this market.
If this space continues to see negativity, I think the $26.50 level will be important to keep an eye on, because that is the next major support level. If silver turns around and recaptures the $28.50 level, then the metal could recover. However, it’s becoming more and more likely that we will continue to see downward pressure.
DAX

(Click on image to enlarge)
The German index similarly witnessed quite a bit of negativity during the course of the week as it slid through the EUR18,650 level, and it now looks like it could be heading toward the EUR18,000 level.
This is a market that I think will continues to see a lot of noisy behavior. With this, I like the idea of waiting to see what happens at the EUR18,000 level, because it could tell us where the index may go over the long-term.
EUR/USD

(Click on image to enlarge)
The euro initially rallied during the course of the trading week to break above the 1.11 level, but it then turned around to show signs of extreme weakness. The market will likely continue to see a lot of volatility, and with the jobs number coming out as weak as it did in the United States, it’ll be interesting to see where it goes from here.
I think traders will have to pay close attention to what’s going on, but they will also have to pay close attention to whether or not risk appetite starts to disappear. If it does, that could turn things around and see the US dollar strengthen quite drastically. All things being equal, I expect to see a very choppy and noisy EUR/USD market.
AUD/USD

(Click on image to enlarge)
The Australian dollar plunged during the week on bad economic news around the world. Chinese demand has slowed down, and now the US jobs numbers came out weaker than anticipated. This suggests that perhaps the market might be looking at a global slowdown, and such an event would have a major influence on Australia.
I think traders should pay close attention to the AUD/USD market at this point, because it could serve as a barometer of risk. If the Australian dollar starts to strengthen again, that would be good for other markets. The 0.6650 level is a significant support level to keep an eye on.
Nasdaq 100

(Click on image to enlarge)
The Nasdaq 100 plunged during the week to crack below the 18,500 level, and now it is a matter of whether or not there is enough support here to turn the market back around. If it continues to go lower, this could be the beginning of something rather ugly.
This looks to be a rather dangerous level. Traders should be cautious about trying to get into the market at this point, as they may be better off waiting for the market to signal which way it’s going to go.
Bitcoin

(Click on image to enlarge)
Bitcoin experienced a rather tough week. At this point in time, I think it will likely go down to the $50,000 level, which is a large, round, psychologically significant figure, and an area that has previously seen some price action.
If Bitcoin breaks down below the $50,000 level, that would be a horrific turn of events that could see the cryptocurrency plunge even deeper to the downside. At this point, we would need to recapture the $57,500 level to get bullish again.
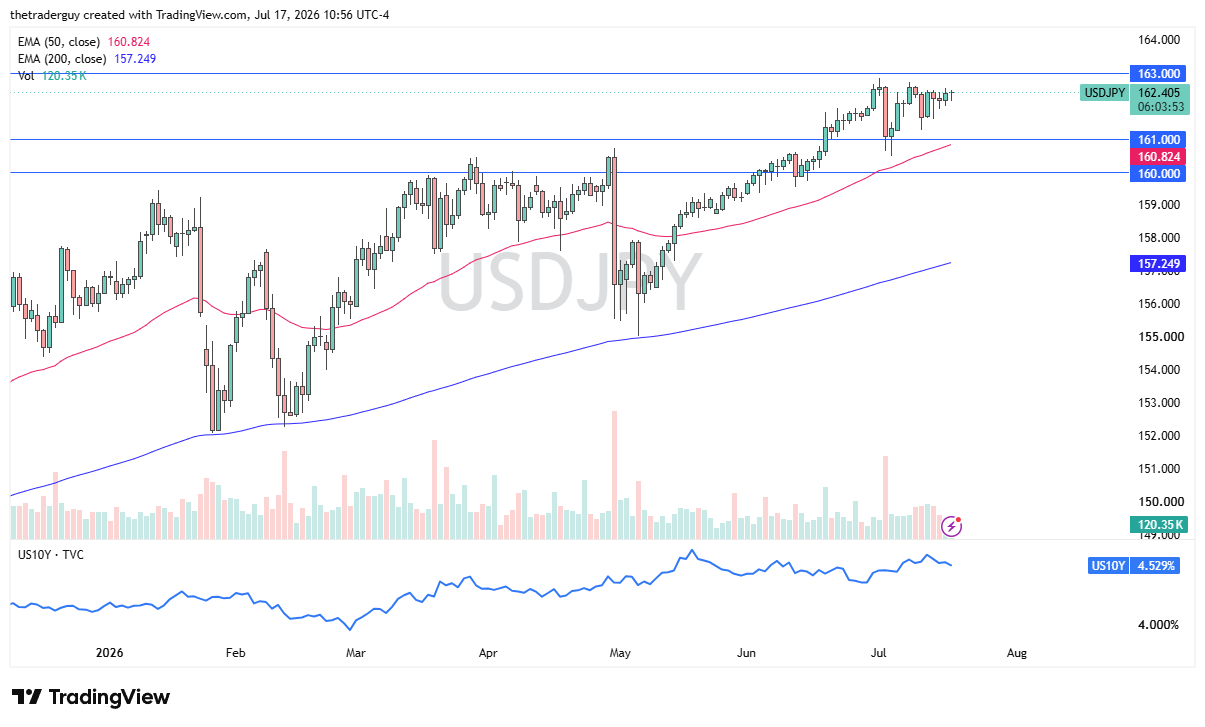
USD/JPY

(Click on image to enlarge)
The US dollar has initially tried to rally against the Japanese yen during the trading week, as it turned around to show signs of life again. It is now a matter of whether or not the JPY142 level will continue to offer support, and if the massive uptrend line will continue its streak.
As long as those hold, then the pair is likely to perform well. If we were to see a break down below the JPY141 level, then such a move would be a major breach of support that could send the pair plunging.
More By This Author:
GBP/USD Forecast: Eyes Bullish BreakoutNatural Gas Forecast: Pulls Back After Surge
GBP/USD Forecast: British Pound Recovers Against Greenback On Monday


Comments
Log in or sign up to join the conversation.