Pairs In Focus - Sunday, Sept. 28
Image Source: Unsplash
Gold
(Click on image to enlarge)
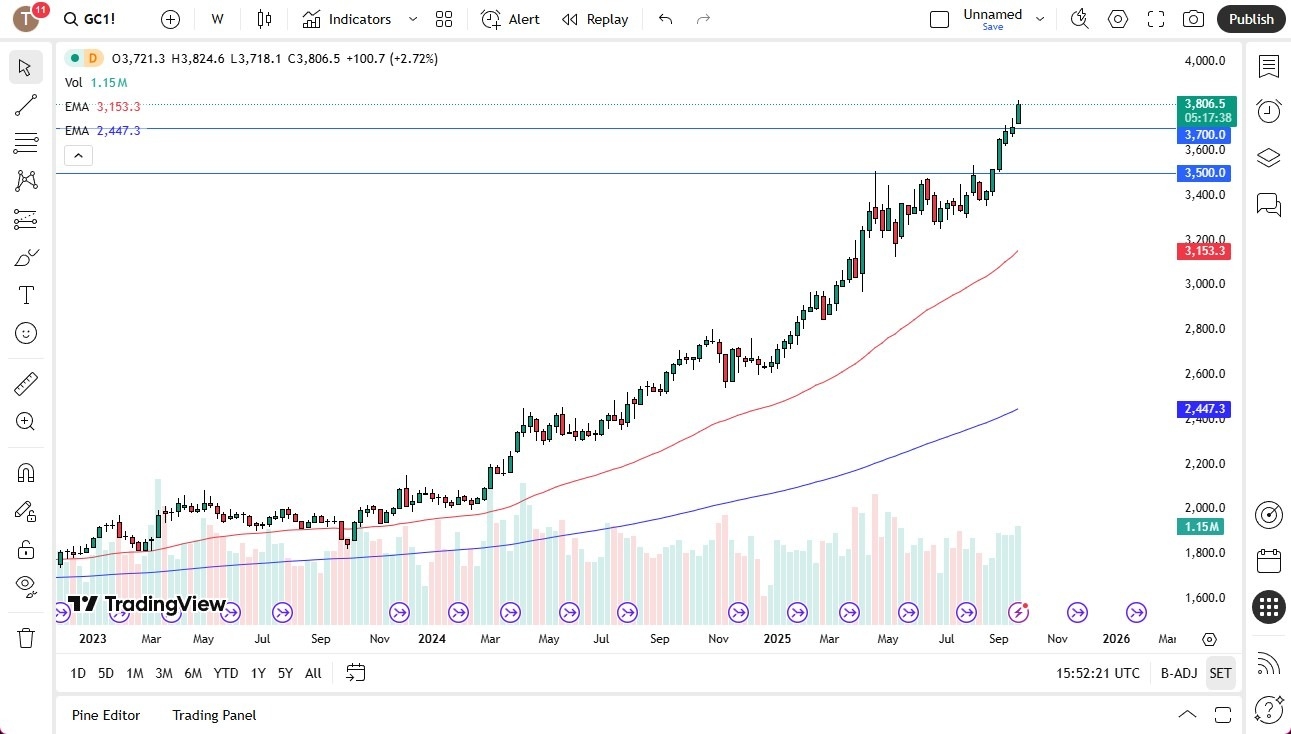
Gold markets rallied quite nicely during the trading week, as gold threatened to break far above the $3800 level. A short-term pullback at this point in time would make sense, as the yellow metal has printed green candles for six weeks in a row.
That being said, any pullback at this point in time would likely find buyers near the $3700 level, assuming that it can even drop that far. Gold is often explosive in its momentum, but it will eventually have to reach lower prices to attract new buyers.
Bitcoin
(Click on image to enlarge)
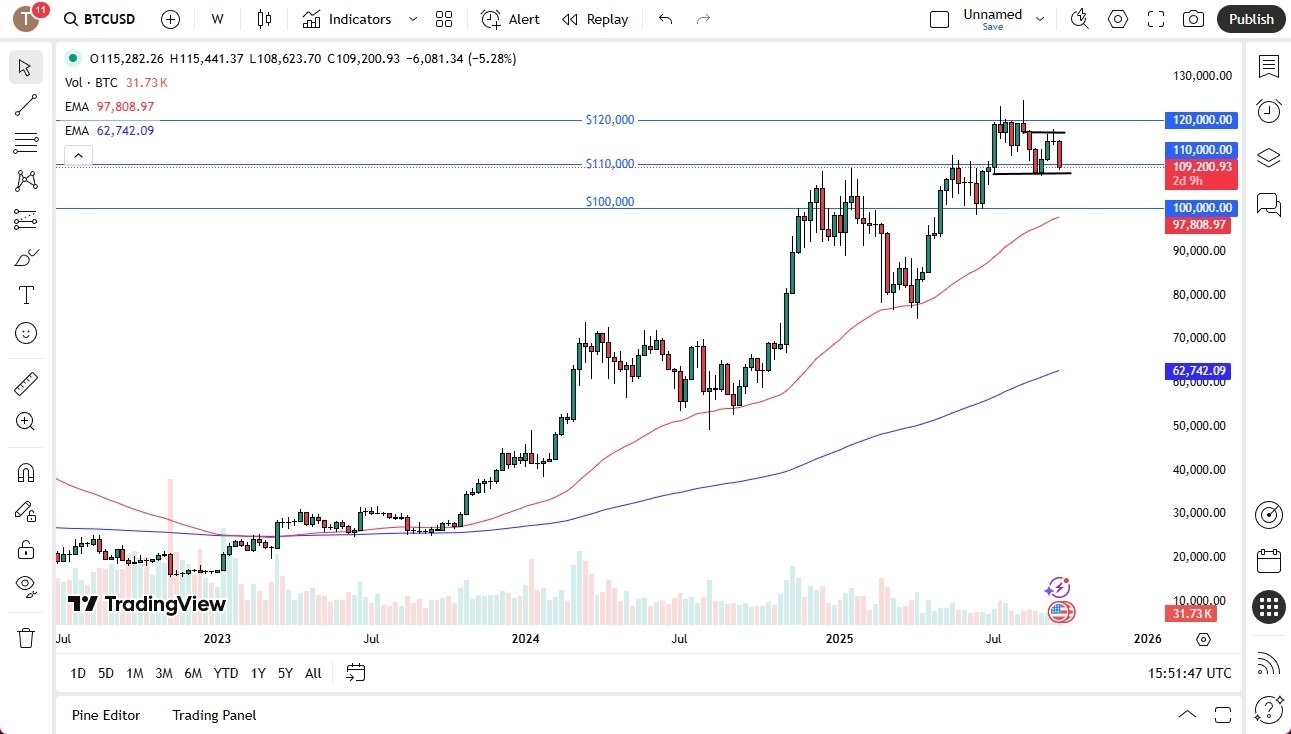
Bitcoin fell rather hard during the course of the trading week, as it continued to threaten the $110,000 support level, which is an area that previously had provided resistance as well as support. It has been hovering just a little bit below that level, and the $107,000 level underneath may also offer some support.
Ultimately, this is a market that is still in an uptrend, but it obviously is struggling to find some type of momentum. That could end up being a bit of a problem, and it would not surprise me at all to see Bitcoin break down to the $100,000 level or to the 50-week EMA. On the other hand, a rally would likely see Bitcoin attempt to challenge the $117,000 level.
Silver
(Click on image to enlarge)
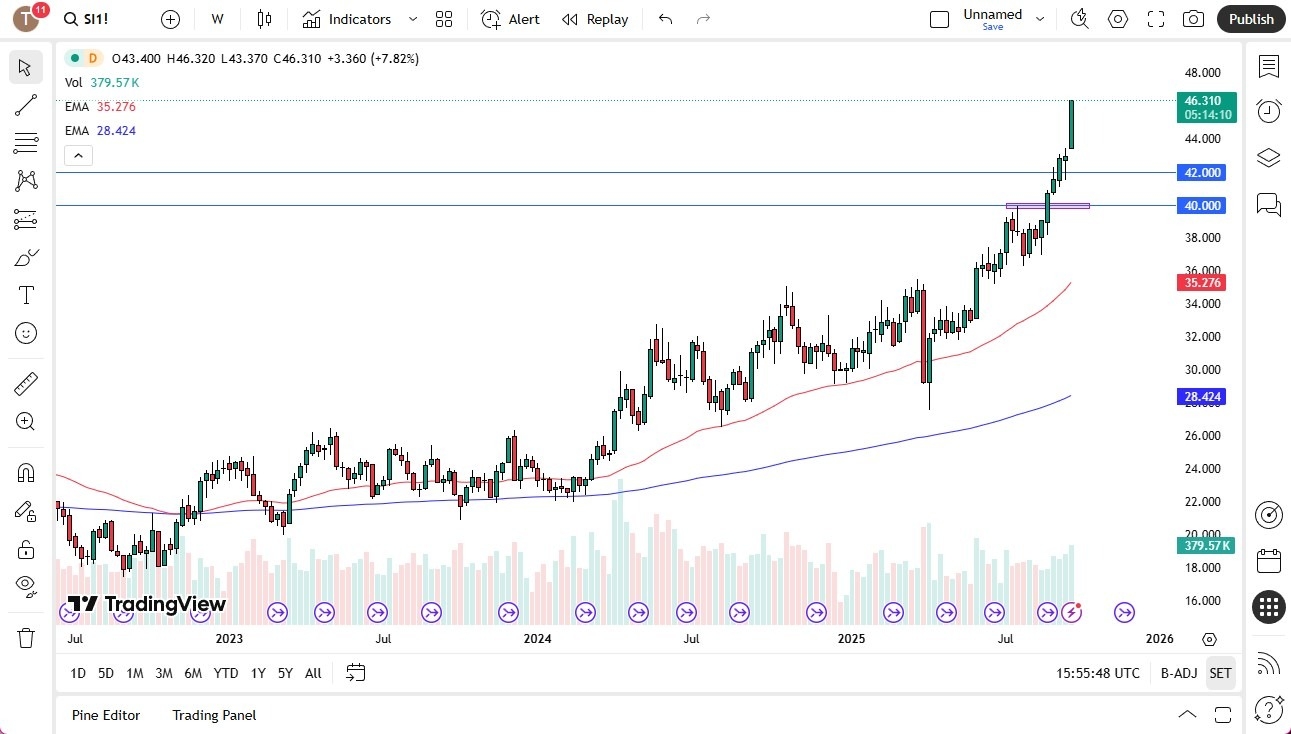
Silver witnessed another explosive week as it continued to experience a lot of noise. That being said, the market will likely see some exhaustion at some point. As the gray metal gained roughly 12% in just a few short weeks, gravity must come back into the picture sooner or later.
Any pullback at this point in time should be thought of as a potential buying opportunity, but I also recognize that shorting this market would be very difficult to do, and therefore a little bit of patience would probably go a long way.
USD/JPY
(Click on image to enlarge)
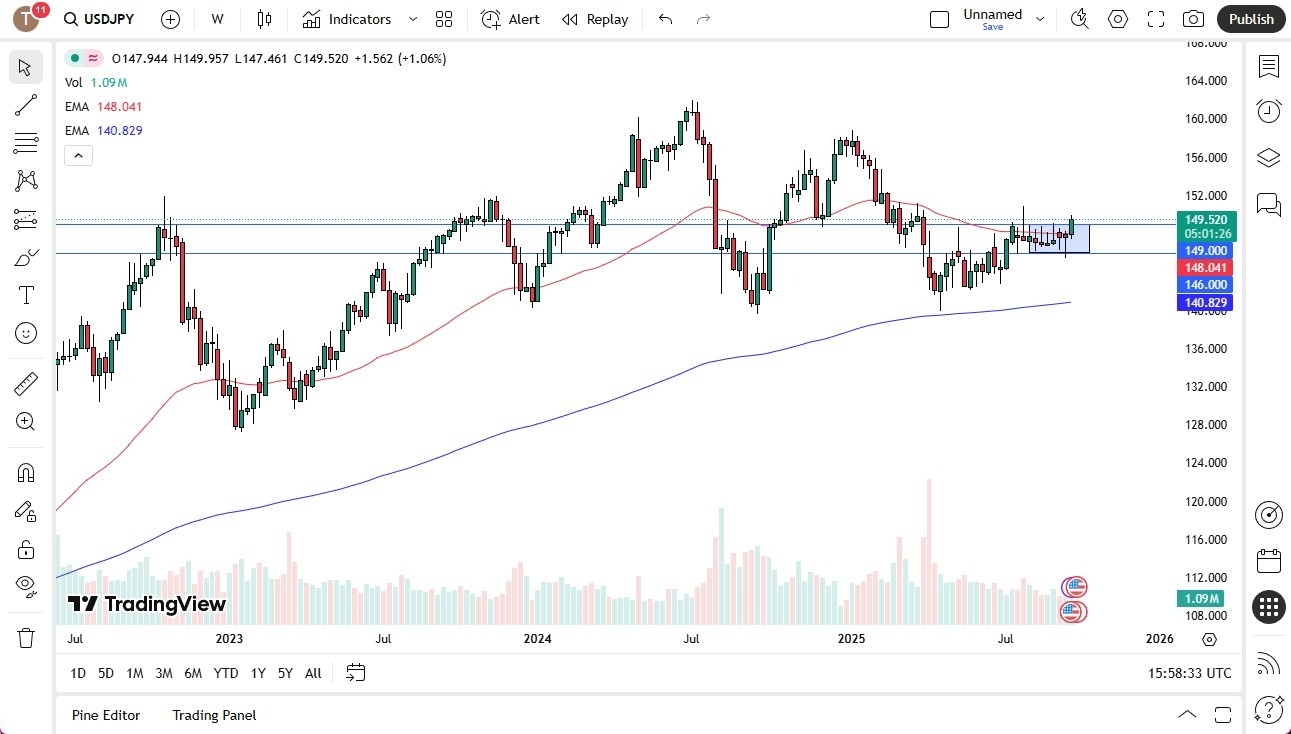
The US dollar rallied a bit during the course of the week, as it broke above the JPY149 level. This move was a breach of the major consolidation area that the dollar has been stuck in for the past couple of months. As a result, the market may continue to experience a lot of noise. Additionally, I think it is probably only a matter of time before it can test the crucial JPY151 level, the top of a major shooting star formation from about two and half weeks ago.
If it can break above that candlestick, then the US dollar could go looking toward the JPY156 level. Short-term pullbacks may be possible, and they would likely continue to offer value. However, a break down to the JPY146 level would see things quickly turn negative.
USD/CHF
(Click on image to enlarge)
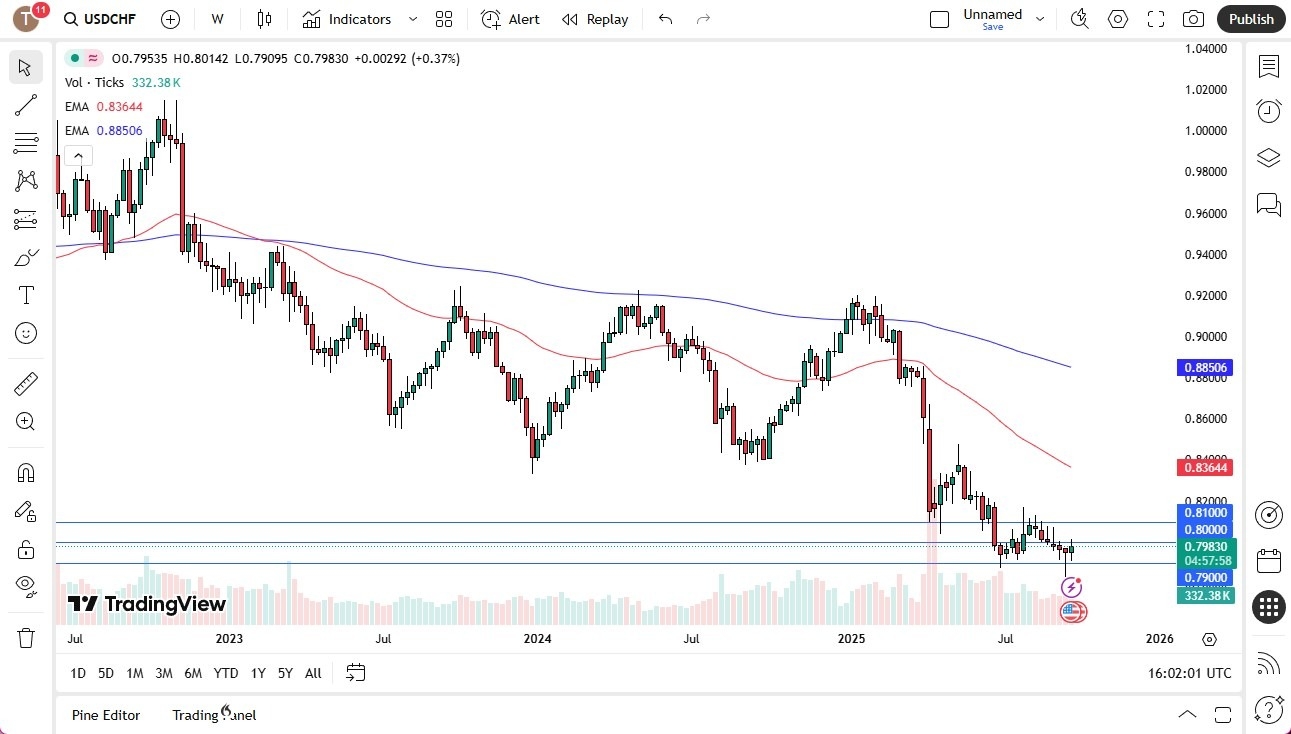
The US dollar moved back and forth against the Swiss franc throughout the previous week, as it seemingly attempted to reach a bottom. The 0.79 level has continued to serve as a major support level, but it’s also worth noting that the 0.80 level above has offered resistance, just like the 0.81 level.
Because of this, the market will likely continue to see some choppy, sideways momentum in this area. Keep in mind that this currency pair has seen primarily sideways movement for two months, and it certainly doesn't look like this will change anytime soon.
USD/MXN
(Click on image to enlarge)
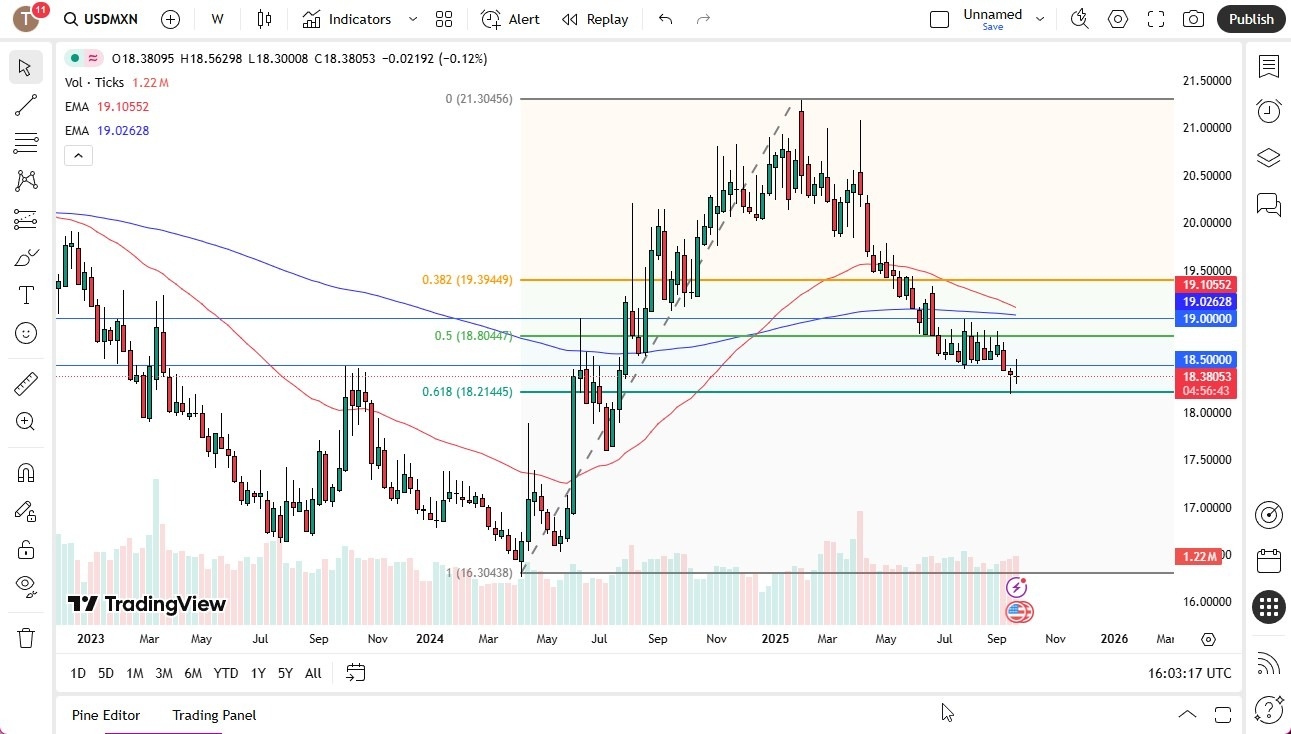
The US dollar fluctuated rapidly against the Mexican peso during the trading week, which is probably not a huge surprise considering that the previous week ended up forming a massive hammer structure.
If the currency pair could break down below that hammer from the previous week, such a move could open up the potential of a decline to the MXN18 level. On the other hand, a rally from this point in time could see the MXN18.80 level become the next target, although that would be a rather optimistic scenario.
EUR/USD
(Click on image to enlarge)
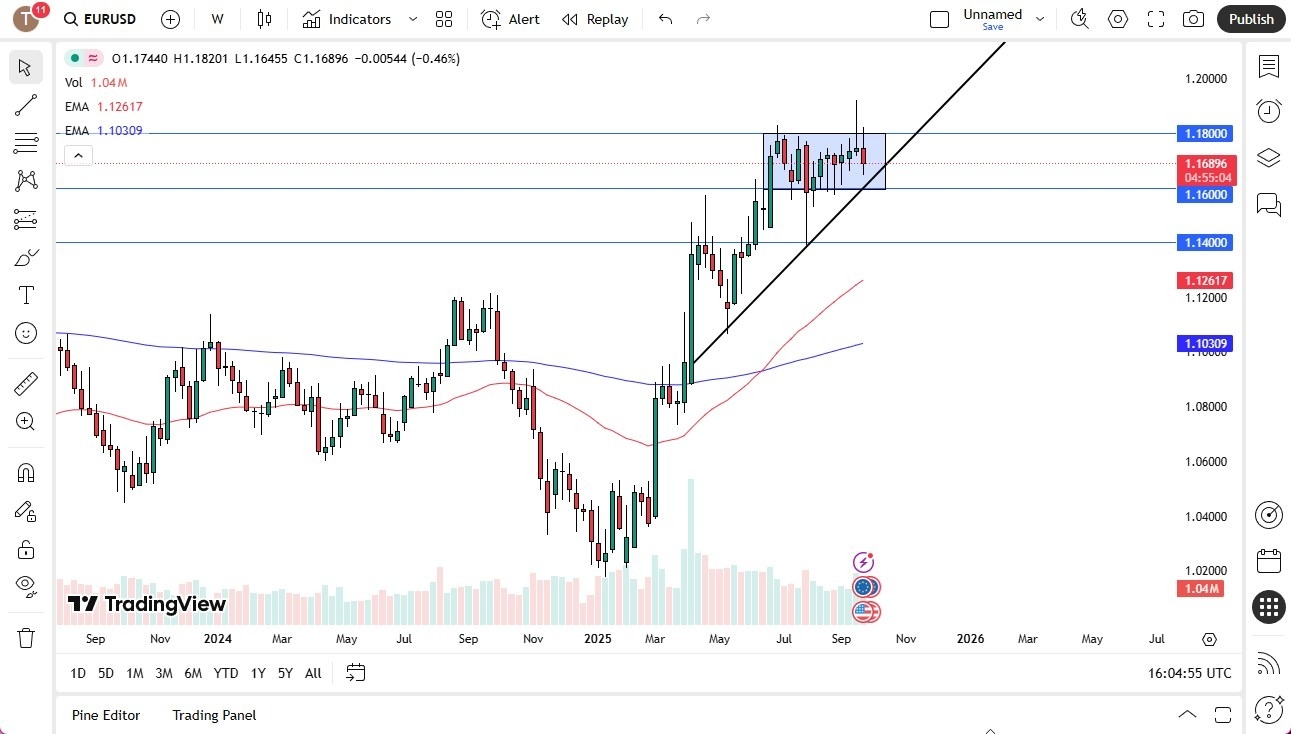
The euro was rather negative throughout the week, as it moved back and forth during trading. It broke above the 1.18 level, only to then turn around and collapse toward the 1.1650 level.
Ultimately, it appears to be stuck in sideways trading, with a floor at the 1.16 mark and a ceiling at the 1.18 level. I don't know if that will likely change in the near-term. However, a break out of the 200 pip range could serve as an indicator as to which direction the market could move in.
GBP/USD
(Click on image to enlarge)
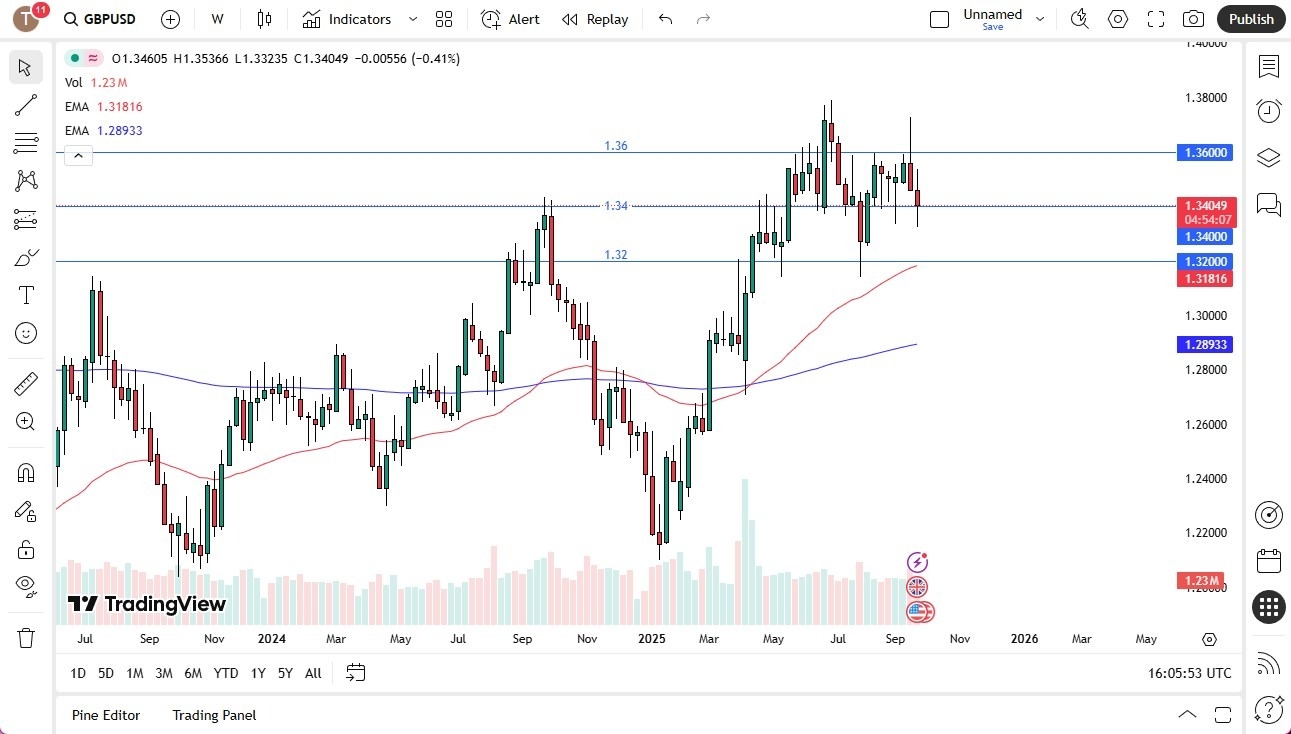
The British pound moved all over the place throughout the past week, but it recently settled at around the 1.34 level. This level has previously served as both support and resistance, and thus it has seen quite a bit of price action.
Ultimately, the pound has seemingly been stuck in a 400 pip range, with the 1.32 level being the floor in the market and the 1.36 figure being the ceiling. As it has been basically halted in the middle of this range, the currency pair will likely remain somewhat neutral in the short-term.
More By This Author:
BTC/USD Forecast: Drops SignificantlyEUR/USD Forecast: Falls Toward Key 1.16 Support
Natural Gas Forecast: Is A Floor Forming?
Disclosure: DailyForex will not be held liable for any loss or damage resulting from reliance on the information contained within this website including market news, analysis, trading signals ...
more
