

Image Source: Unsplash
Gold

(Click on image to enlarge)
Gold markets initially tried to rally during the course of the week, but they then turned around to show signs of weakness. The precious metals space appears to be a little stretched, and there has been quite a lot of bullish pressure in recent days. Additionally, Friday led into a three-day weekend in the United States, so I would not read too much in the recent pullback. Ultimately, gold is still going to attract inflows.
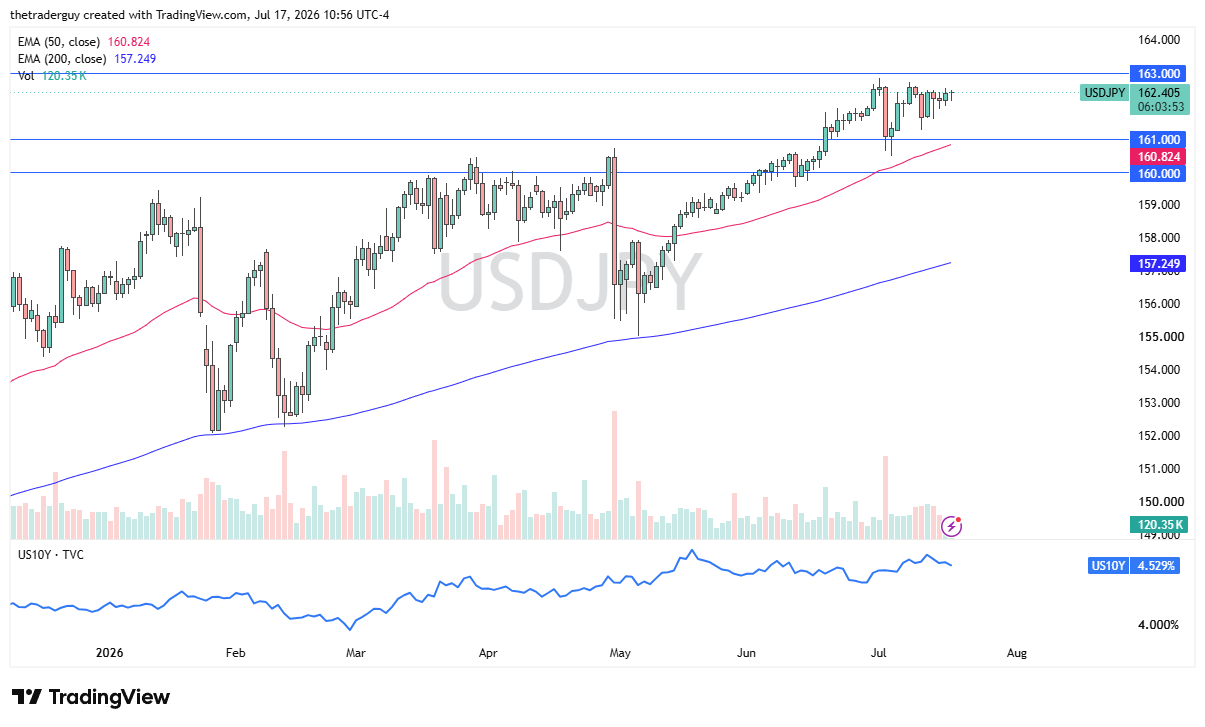
USD/JPY

(Click on image to enlarge)
The US dollar rallied quite significantly during the course of the week, as it bounced from a major trend line. I believe the USD/JPY market will continue to see a lot of volatility and noise, despite some lingering signs of life. The uptrend line is an area that people will likely be paying close attention to, and the fact that the pair stabilized near it could suggest the beginning of a turnaround.
WTI Crude Oil

(Click on image to enlarge)
Crude oil initially tried to rally during the course of the week, before it turned around to show signs of weakness. This is a market that has been range-bound for a couple of years now, and I think the $75 level has been a bit of a magnet. I think price action will continue to move sideways, as traders do not seem to have any major momentum left to push the market.
Silver

(Click on image to enlarge)
Silver initially tried to rally during the week, but it fell apart on Friday. The silver market will likely continue to see a lot of noisy behavior, and with this being the case, I think traders may shy away from silver.
That being said, the $28.50 level underneath is a significant support level, as it had been previous resistance. The market is likely to continue to see a lot of “buy on the dip” traders out there. A weakening US dollar could benefit the space.
DAX

(Click on image to enlarge)
The German index rallied during the course of the week yet again, and it even managed to mark a new all-time high. That being said, the index did give back a little bit of the gains, but short-term pullbacks are likely going to continue to attract a lot of attention.
With that being the case, I think the index will continue to go much higher. However, it does appear to be a little stretched, so don’t be surprised to see a short-term dip. Over the longer-term, I believe that the index could go much higher if given enough time.
EUR/USD

(Click on image to enlarge)
The euro pulled back significantly from the 1.12 level, which is an area that has been important more than once. In fact, it not only pulled back from there, but it also collapsed. The question now is whether or not the euro will continue to find buyers on dips, or will it continue to drop?
I think at this point in time, it’s an open question. I’d be very cautious with the EUR/USD currency pair at this point, and I have no interest in trying to trade the market. However, if the pair were to break lower, such a move could suggest the strengthening of the US dollar. This would have a major influence on other FX pairs.
On the other hand, if the euro could turn things back around, then the US dollar would likely sell off against other major currencies. This could be an indicator to use with other trades.
USD/CAD

(Click on image to enlarge)
The US dollar initially dipped against the Canadian dollar during the course of the week, only for it to turn around and show signs of life. It appears to be forming some type of hammer for the week, and that may suggest that it is overstretched and the market is ready to bounce.
Furthermore, I believe that the 1.34 level underneath will offer a significant amount of support, so it may be wise to pay close attention to that. I believe that the Canadian dollar may soften a bit, due to the fact that the GDP numbers in Canada were lower than anticipated on Friday.
GBP/JPY

(Click on image to enlarge)
The British pound initially pulled back a bit during the course of the week, as it used the JPY190 figure as a significant support level. The market has turned around to show signs of life, and it now looks like it is trying to revive the carry trade. If it is successful, then the Japanese yen would probably sell off against almost everything.
More By This Author:
GBP/USD Forecast: Pullback To 1.31 LikelyNatural Gas Forecast: Looking Sideways
Gold Forecast: Looking For A Breakout


Comments
Log in or sign up to join the conversation.