Pairs In Focus - Sunday, Sept. 15
Image Source: Unsplash
NZD/USD
(Click on image to enlarge)
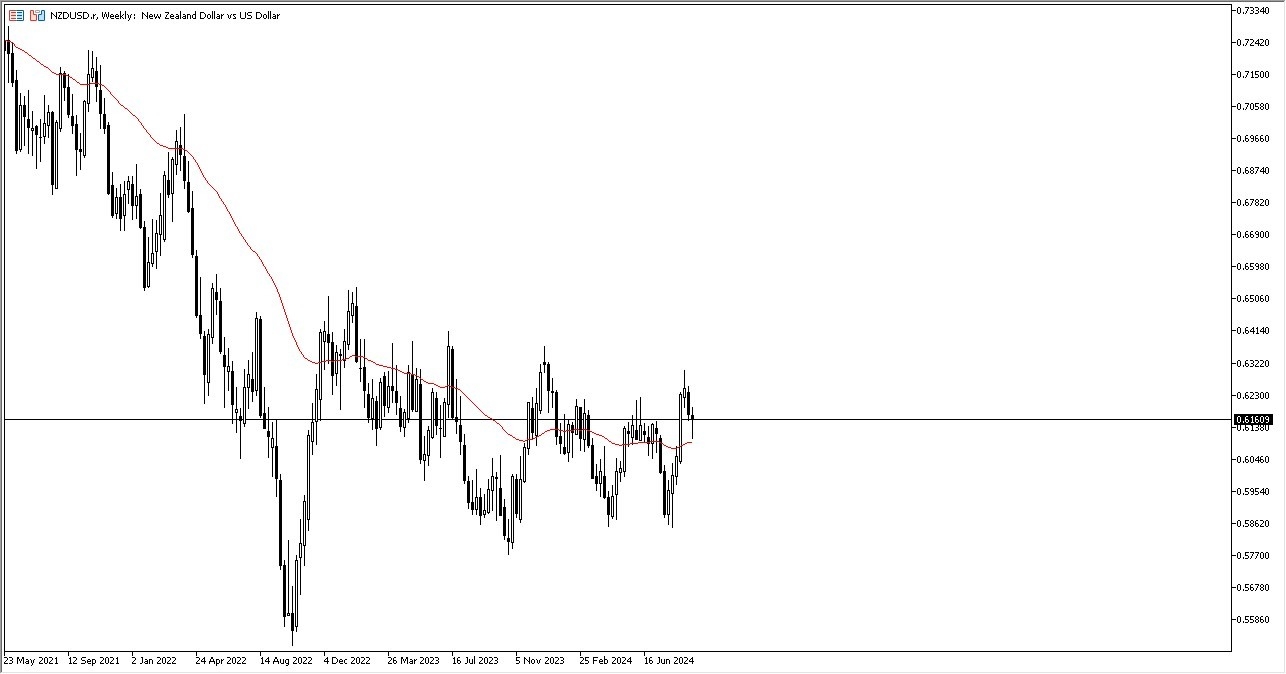
The New Zealand dollar initially fell during the course of the trading week, only for it to turn around and show signs of life. By turning around the way it did, the market ended up forming a bit of a hammer, and that may suggest that there could be a little bit more bullish pressure to come.
The 50-week EMA offered support, and it looks as though the 0.63 level above could end up being a bit of a barrier. If we were to see a break above there, then the New Zealand dollar could continue to go much higher.
USD/CHF
(Click on image to enlarge)
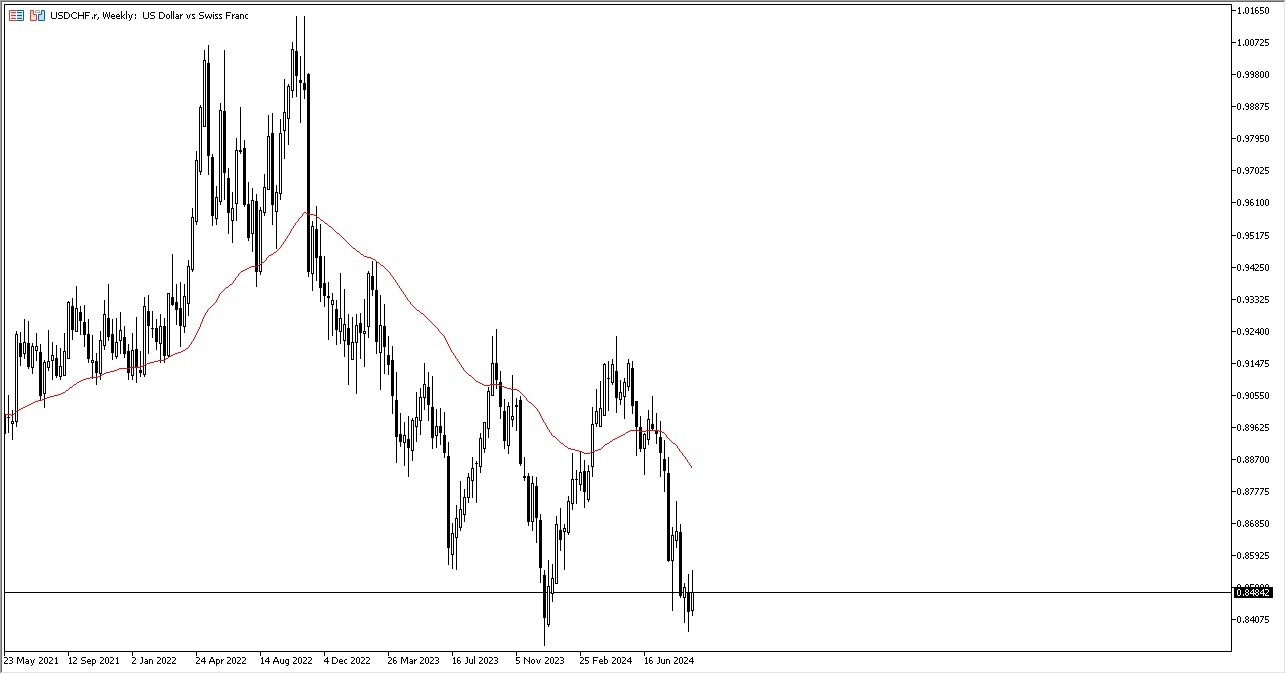
The US dollar rallied during the course of the week, but it's worth noting that the Friday session was a bit negative. It looks like the 0.84 level is going to continue to be a major support level, as it has been an important area multiple times in the past.
This is a market that I think will continue to see a lot of volatility, as the US dollar might be the riskier of the currencies in this particular pair. It’ll be interesting to see how this plays out, because there are a lot of concerns when it comes to the global economy. Thus, I think we will continue to see this market try to break out to the upside, but the price action may also continue to be somewhat sluggish.
Dow Jones 30
(Click on image to enlarge)
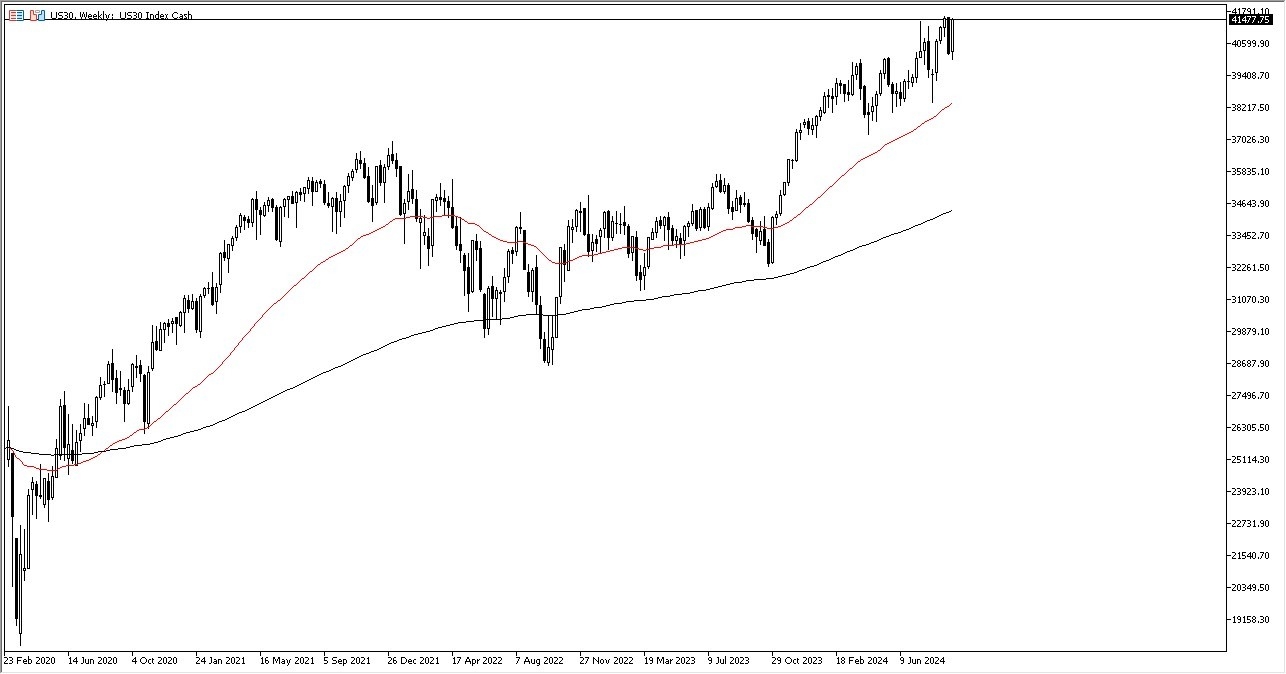
The Dow Jones 30 took off to the upside during the week, and it now appears ready to test the recent all-time high. I think it will continue to go much higher, and eventually it may break out above the 41,800 level, while looking at the 42,000 level as the initial target.
The alternative scenario could be that the Dow Jones 30 may pull back a little bit, perhaps down to the 40,500 level. There are a lot of concerns when it comes to global growth out there, but the Federal Reserve may potentially cut rates on Sept. 18.
Gold
(Click on image to enlarge)
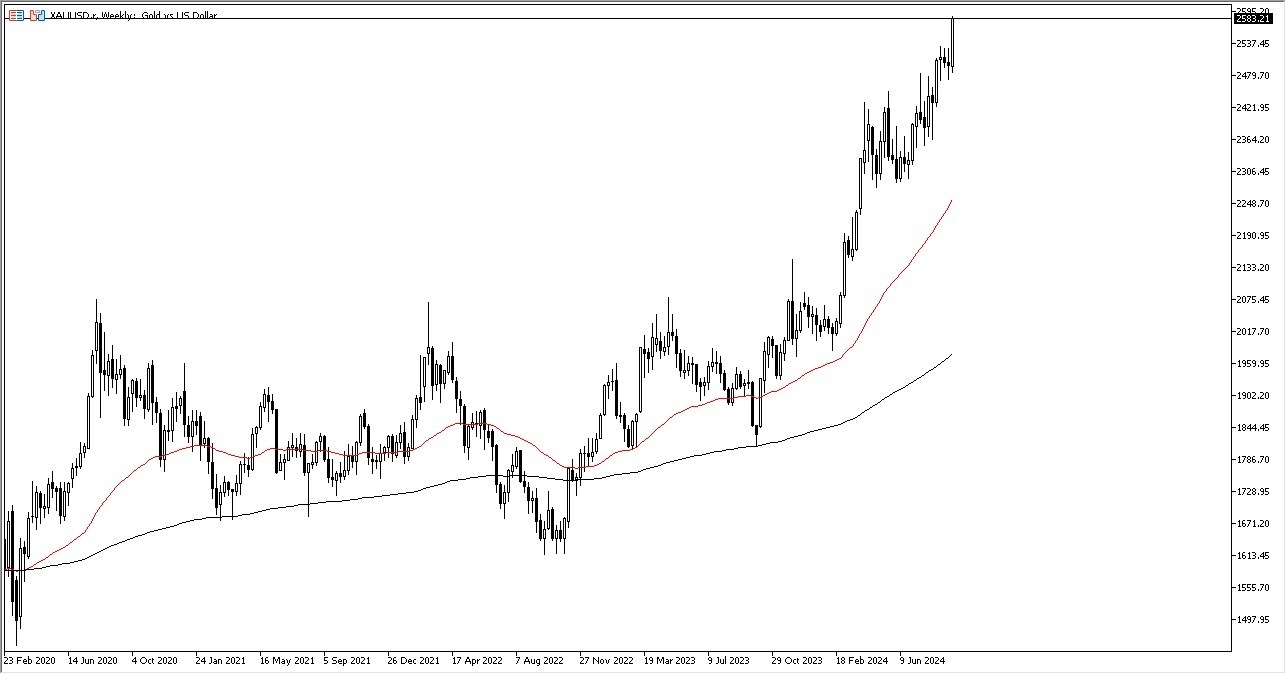
Gold markets rallied again during the week, as the yellow metal formed a very impulsive candlestick. I think that we will see a pullback in this space sooner or later, if for no other reason than the FOMC interest rate decision on Wednesday which will cause a lot of volatility.
Once we get through that, the gold market could continue go much higher. I am a buyer of dips, and I have no interest whatsoever in trying to short this market.
VIX
(Click on image to enlarge)
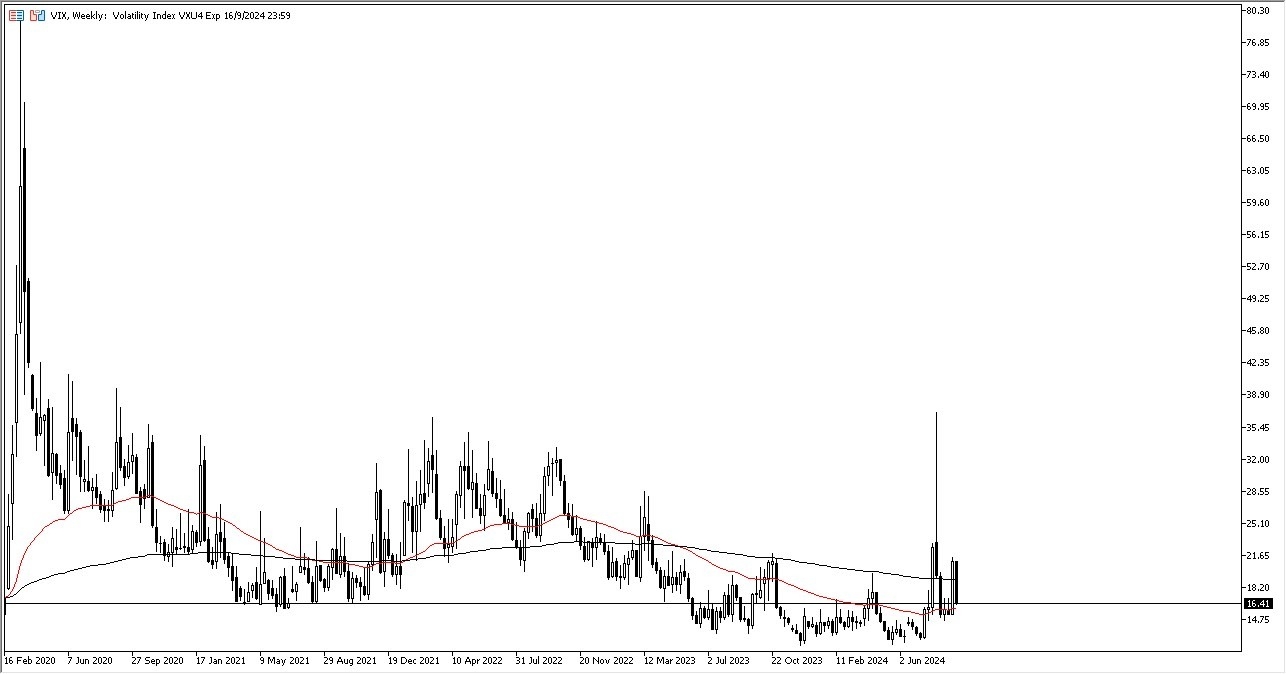
Looking at the VIX, it’s easy to see that it collapsed throughout the trading period after experiencing such a massive surge during the previous week. I think this market may be somewhat complacent.
While most people don’t trade this futures contract, it could be worth paying attention to if you trade stocks in the United States. I suspect that if we see it break down below the 15 level, then it would be time to start being cautious about buying stocks again, and perhaps time to start taking profit in long positions.
Silver
(Click on image to enlarge)
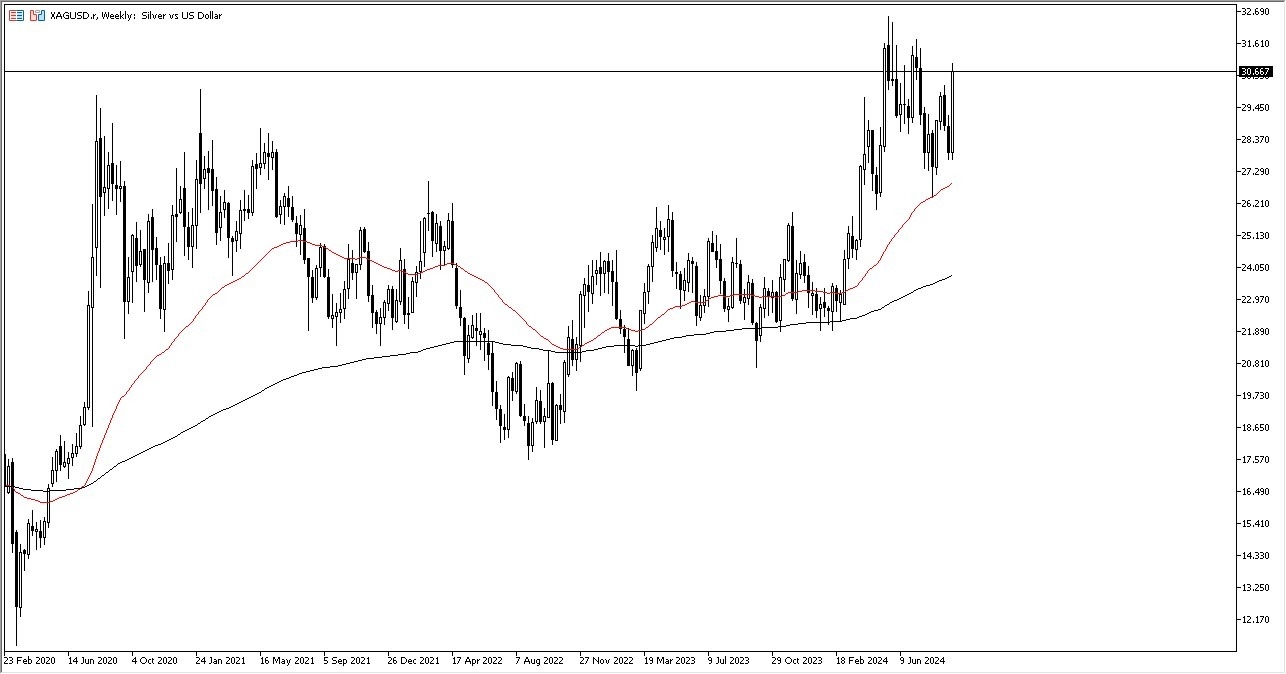
Silver rallied rather significantly during the course of the week to break well above the $30 level. Keep in mind this is a market that is extraordinarily volatile, but the size of the candlestick suggests that the buyers have stepped back in and taken the reins.
I think we will probably see a little bit of a pullback due to the FOMC meeting in the middle of the week, but that should end up being a nice buying opportunity. The $20.50 level should hold a significant amount of support.
USD/CNH
(Click on image to enlarge)
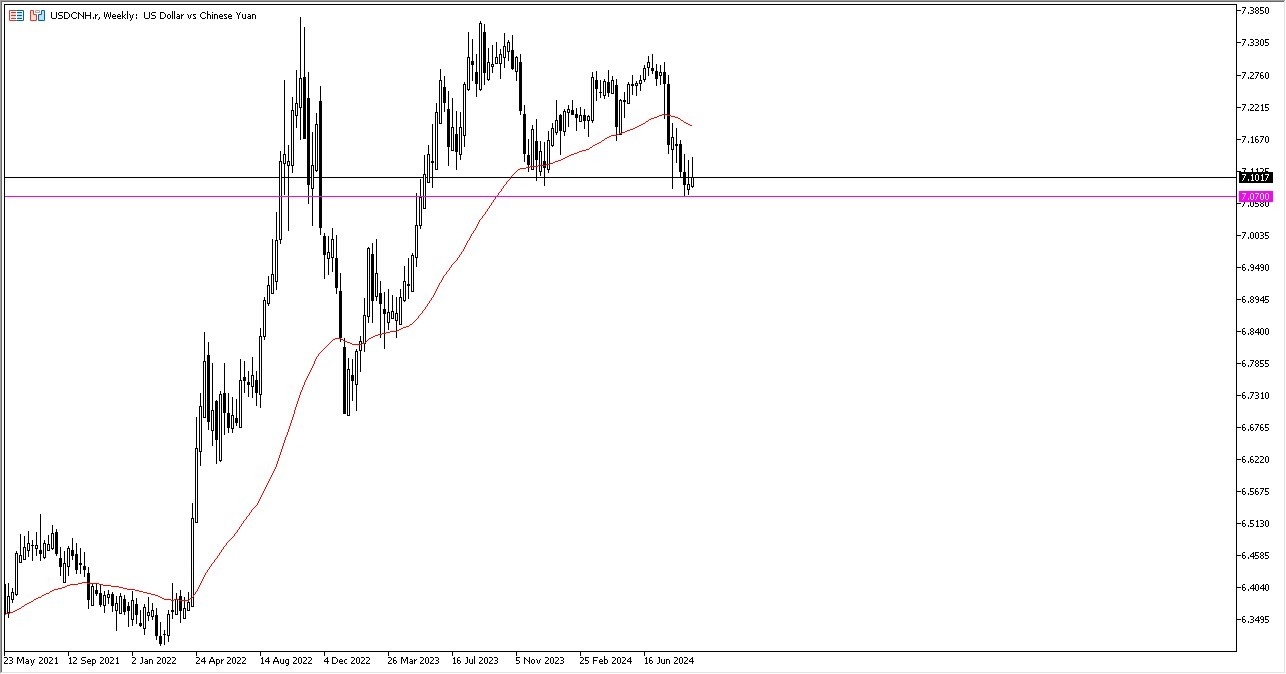
The US dollar rallied a bit during the course of the week against the Chinese yuan, but it has recently struggled near the 7.13 level yet again. We have seen this pattern play out over the period of three weeks now. Every time it rallied, sellers came back into the market and started shorting the greenback.
With that being said, the market is likely to continue to see a lot of support underneath, especially near the 7.07 level, which is an area that has been extraordinarily supportive over the last couple of months. Keep in mind that this is a risk on/risk off type of scenario, with the US dollar being the ultimate safety currency.
EUR/USD
(Click on image to enlarge)
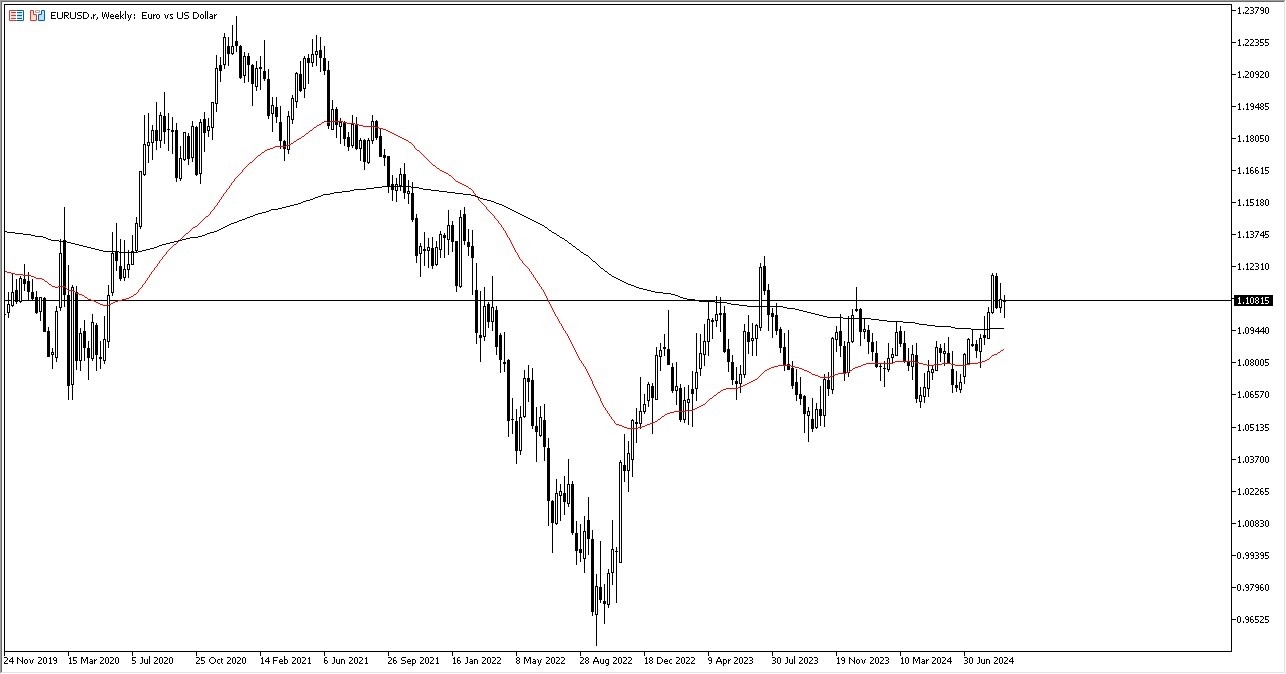
The euro initially dipped during the trading week, only to turn around and show signs of life again. The market ended up forming a bit of a hammer, which may suggest that the 1.10 level underneath could continue to be supported.
If we were to see a break down below there, then the 200-week EMA would be worth paying attention to. On the upside, the 1.12 level above may hold a significant amount of resistance. I think this space will continue to move somewhat sideways overall, perhaps due to a slightly bullish attitude in the EUR/USD market.
More By This Author:
GBP/CHF Forecast: Pressing Higher Against FrancGBP/JPY Forecast: Holds Support At ¥185
EUR/JPY Forecast: Euro Continues To Lose Against Japanese Yen


