Pairs In Focus - Sunday, Oct. 20
Image Source: Unsplash
USD/MXN
(Click on image to enlarge)
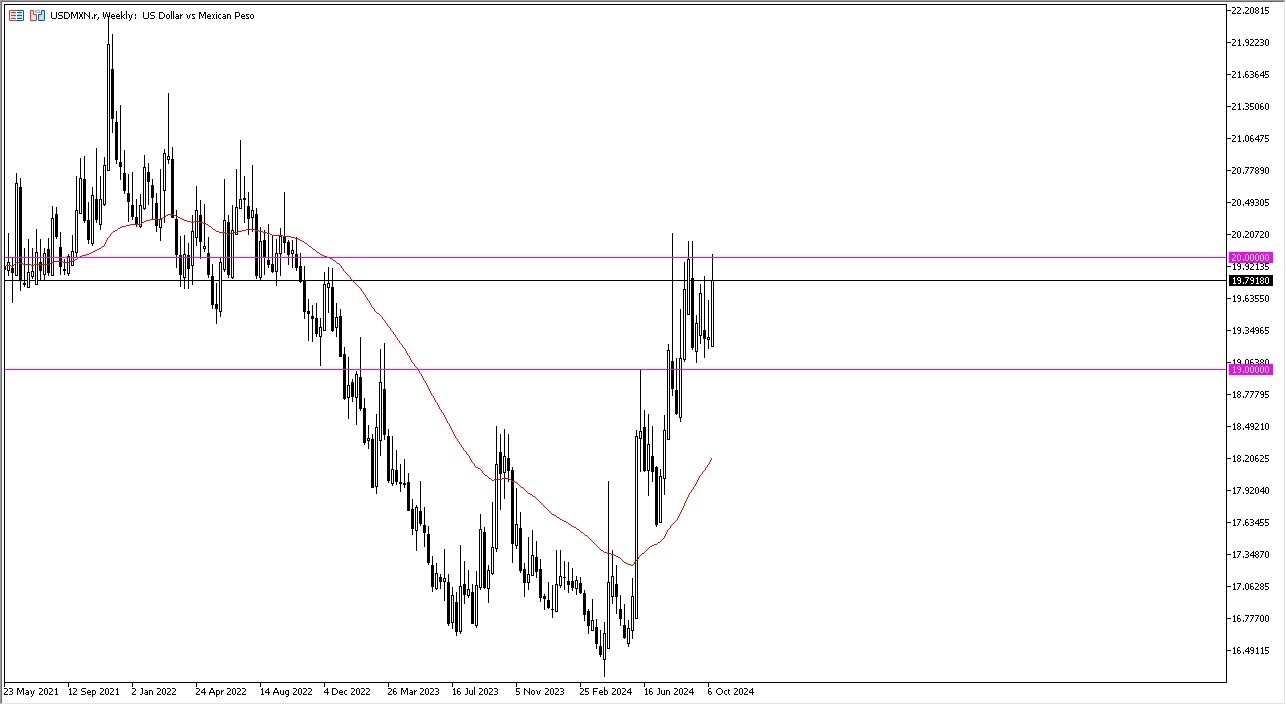
The US dollar continued to punish the Mexican peso throughout the past week. I think the market is in the process of trying to build up enough momentum to finally break out above the crucial 20 MXN level. If and when it does, there could be quite a big move in the currency pair.
However, the 20 MXN area will likely prove to be a difficult one to break out of. At the moment, price action has been bouncing around between the 19 MXN mark and the 20 MXN level, potentially building up some type of inertia.
Dow Jones 30
(Click on image to enlarge)
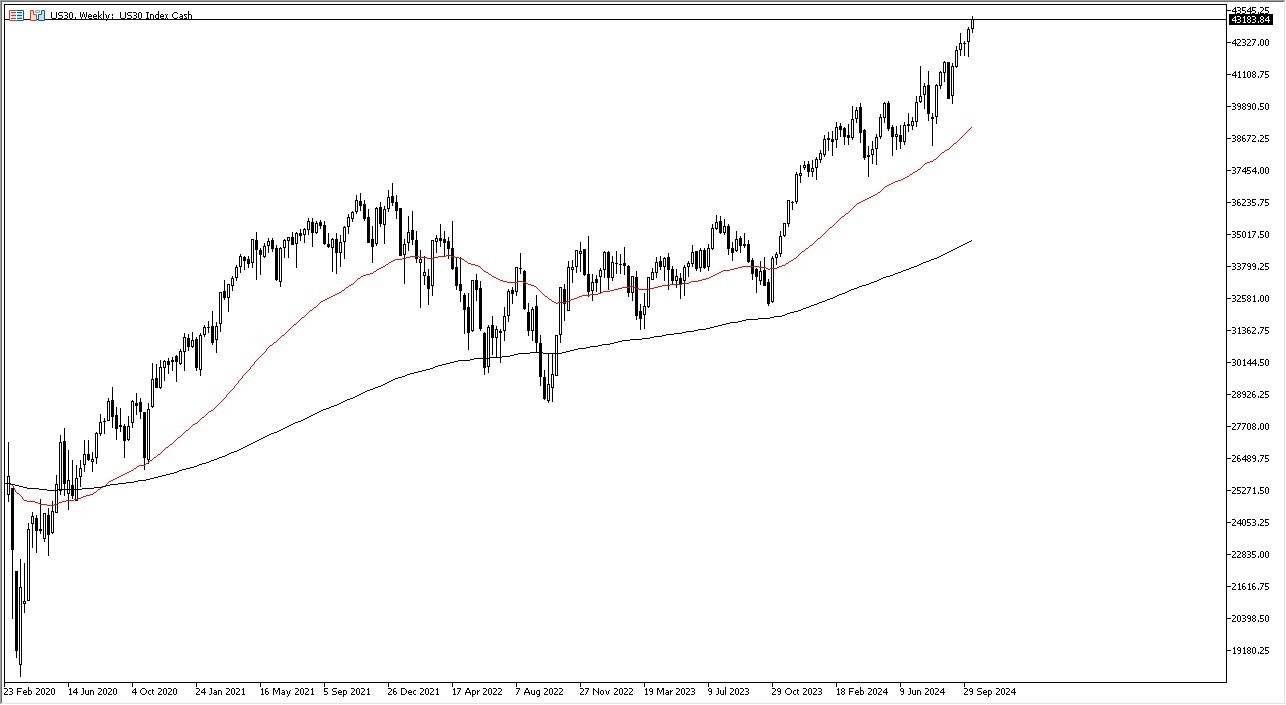
The Dow Jones 30 continued to outperform most other indices, and it now looks poised to break above the 43,200 level. The market appears to be a little overbought at this point, but short-term pullbacks could end up serving as buying opportunities.
The 42,000 level should serve as support. However, there could also be massive support at the 40,000 level, assuming that the Dow even falls that far. Liquidity measures coming out of the Federal Reserve will likely continue to play a part in the Dow Jones 30's positive performance.
GBP/USD
(Click on image to enlarge)
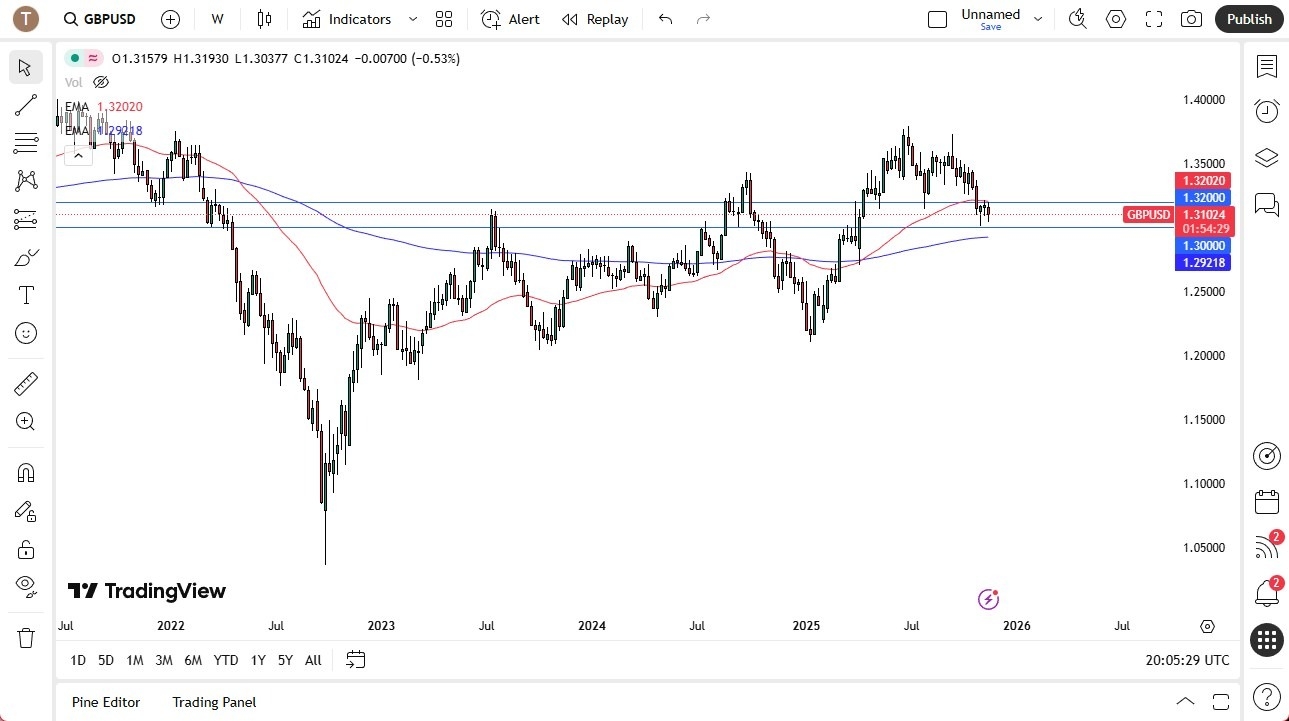
The British pound continued to dance around the 1.30 level in recent trading, and I believe it is now at a major point of inflection. This area will likely continue to be a potential market-moving one, but more importantly, the question will be whether or not it can hold as support.
If it does so, then it’s likely that the British pound could go looking to the 1.33 level, given enough time. If we were to see a break down below the 1.2950 level, then a move down to the 1.28 level could be possible.
AUD/USD
(Click on image to enlarge)
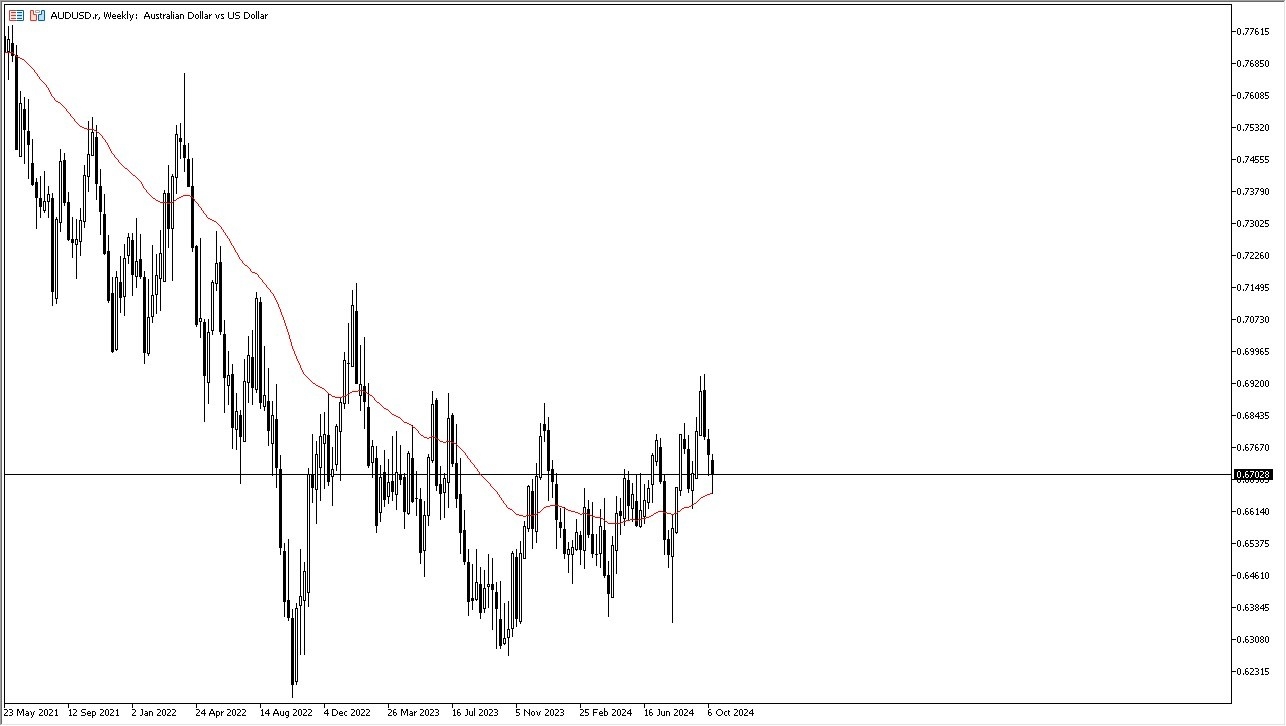
The Australian dollar fell within the range of the 50-week EMA during the trading week, before it then turned around to show signs of life. The market may recover a little bit, perhaps even towards the 0.68 level.
On the other hand, if we were to see a break down below the bottom of the candlestick for the week and the 50-week EMA, we could then witness a drop down to the 0.65 level. Keep in mind that the Australian dollar is highly sensitive to risk appetite.
USD/CHF
(Click on image to enlarge)
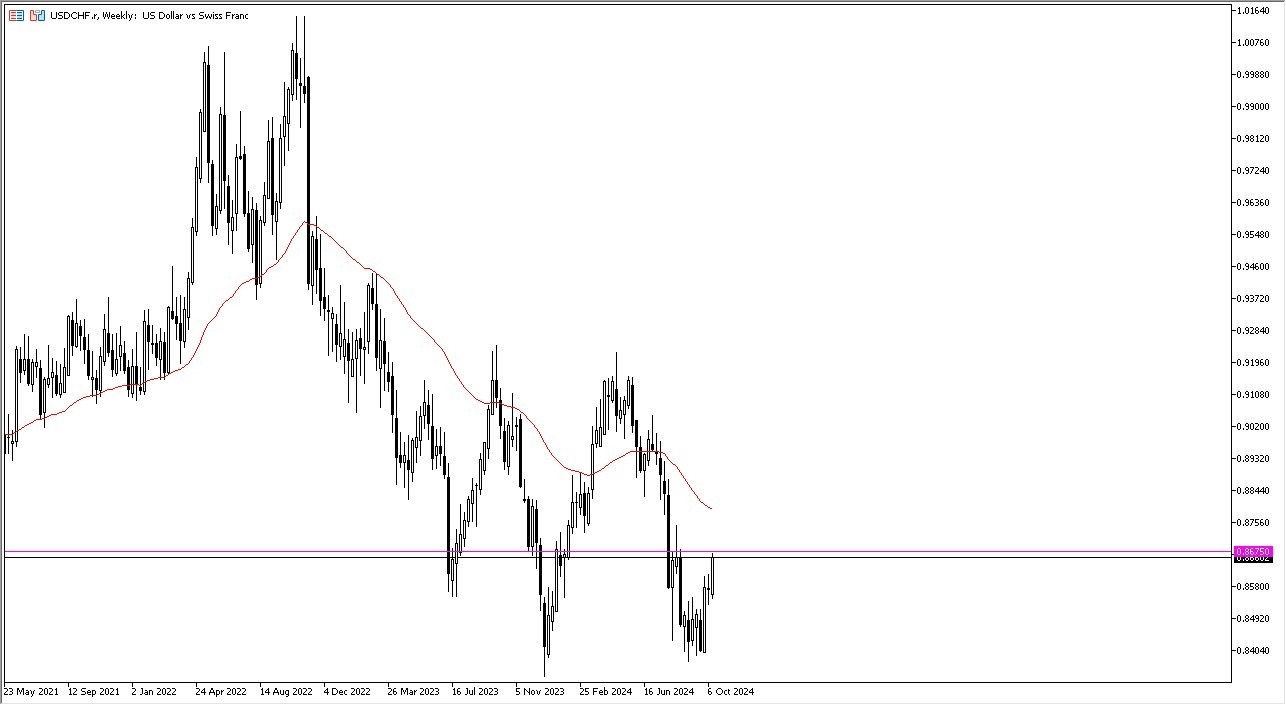
The US dollar rallied once more against the Swiss franc, as it tested the crucial 0.8675 level. I think it’s only a matter of time before it moves higher, but traders should keep in mind that this pair had been sold off quite drastically before this point.
If it can break above the 0.8675 level on a daily close, then the US dollar would likely continue to climb higher against the Swiss franc. If we were to see a pull back, then I would look for signs of support to start buying again.
USD/CAD
(Click on image to enlarge)
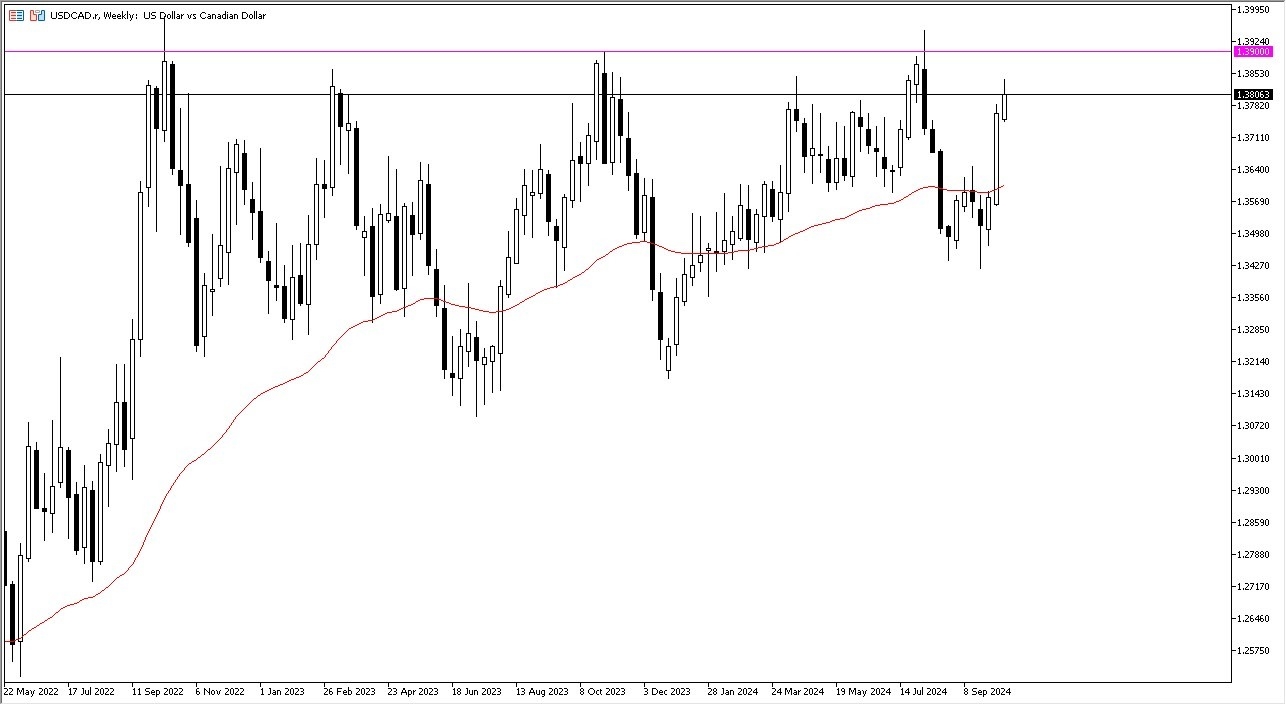
The US dollar continued to rally against the Canadian dollar over the course of the week. It's worth noting that the area that extends to the 1.39 level above is rather significant resistance, so I think that this upward pressure will be somewhat limited in the short-term.
I believe there is a high chance of short-term pullbacks, and that such pullbacks could serve as buying opportunities in this market. If traders were to see a daily close above the crucial 1.39 level, then the pair could go looking toward the 1.40 level in the next few weeks. I have no interest in shorting this currency pair, at least not as things stand right now.
WTI Crude Oil
(Click on image to enlarge)
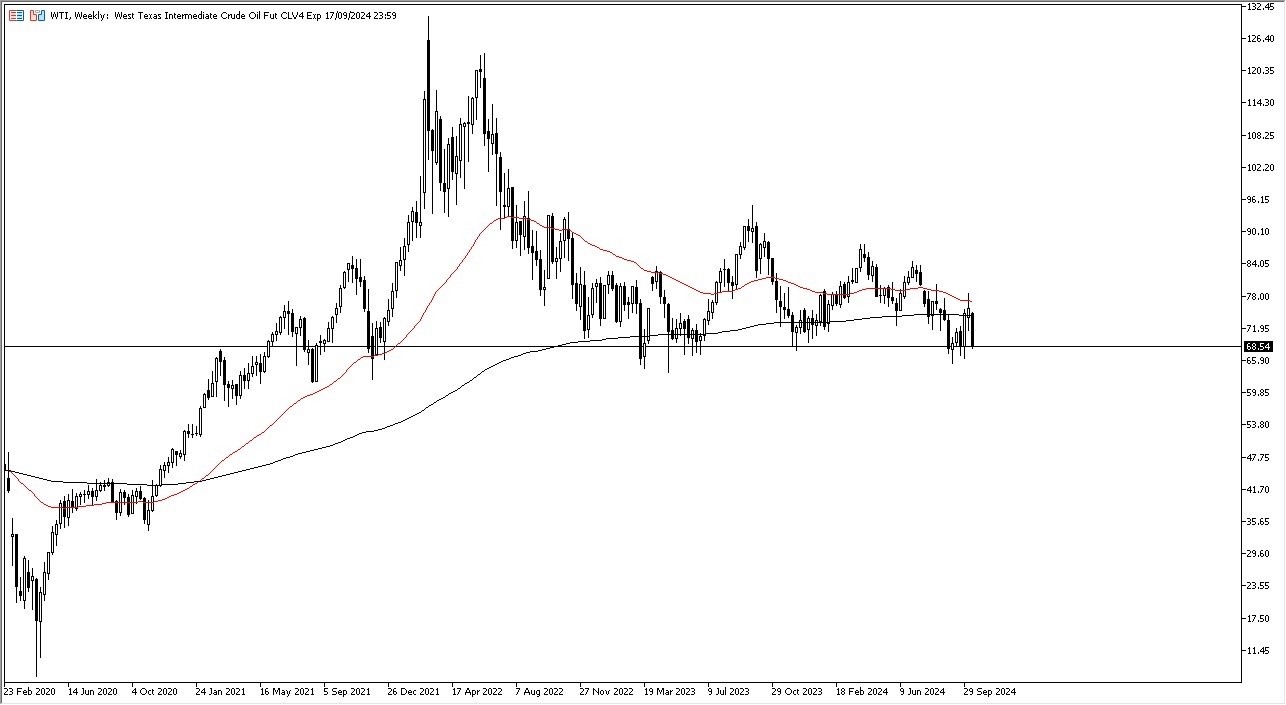
Crude oil fell rather hard during the course of the trading week. As it approached the crucial $68 level, it began to threaten significant support from the last two years.
At this point, some type of support will likely come into the picture, and perhaps even a bounce could appear. If such support doesn't form, crude oil could be in a lot of trouble, and it would likely free-fall from here. If traders were to see a rally, I suspect that the upside would be somewhat limited. Therefore, I think such a scenario would be a short-term opportunity.
Gold
(Click on image to enlarge)
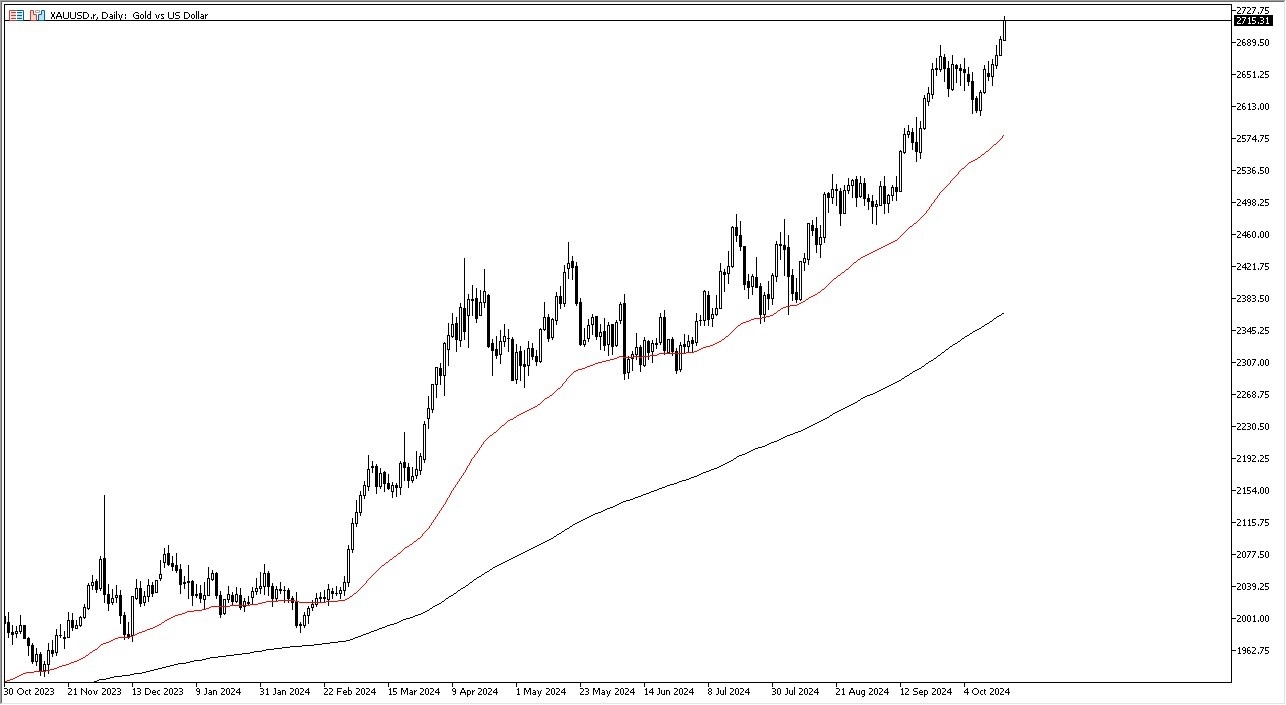
Gold markets rallied rather significantly during the trading week to break above the $2700 mark. The $2700 level is a large, round, psychologically significant figure, but I don’t think it has much more importance than that.
The break to the upside may suggest that gold still has further to go. If you look at the chart, you can see that the bullish flag has been broken to the upside. What could the “measured move” for that bullish flag be? Perhaps the $2800 level. That will be my target for the time being, and I like the idea of buying dips every time they occur in this space.
More By This Author:
USD/CHF Forecast: Dollar Poised For BreakoutCHF/JPY Forecast: Rallies Against JPY
Silver Forecast: Volatility Grips Silver Market
Disclosure: DailyForex will not be held liable for any loss or damage resulting from reliance on the information contained within this website including market news, analysis, trading signals ...
more

