Pairs In Focus - Sunday, Aug. 4
Image Source: Unsplash
USD/NOK
(Click on image to enlarge)
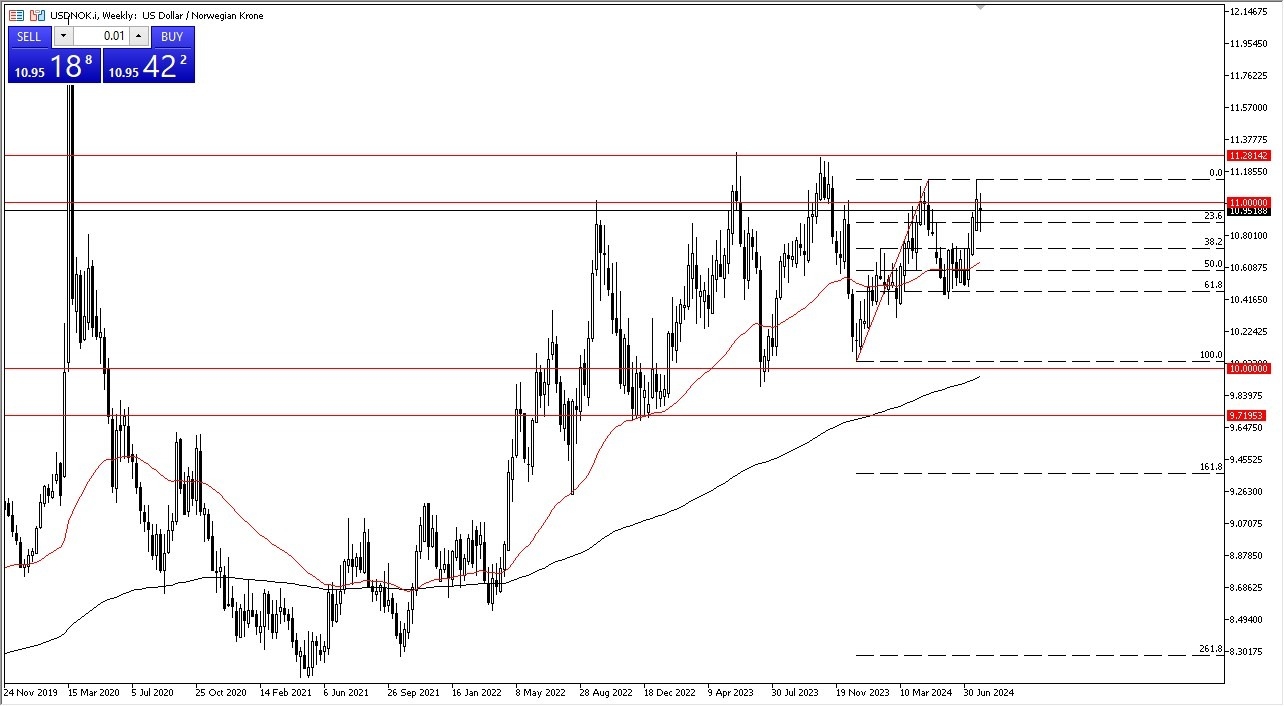
The US dollar moved all over the place during the previous week against the Norwegian krone, which makes sense considering the crude oil markets have seen a lot of volatility recently.
Beyond that, you also have to keep in mind that the Federal Reserve has suggested that there could be rate cuts coming in the future, and the jobs market in the United States put up a miserable number on Friday. At this point, I think this space will continue to see a lot of sideways volatility, with the NOK11 level being a bit of a magnet for price.
Silver
(Click on image to enlarge)
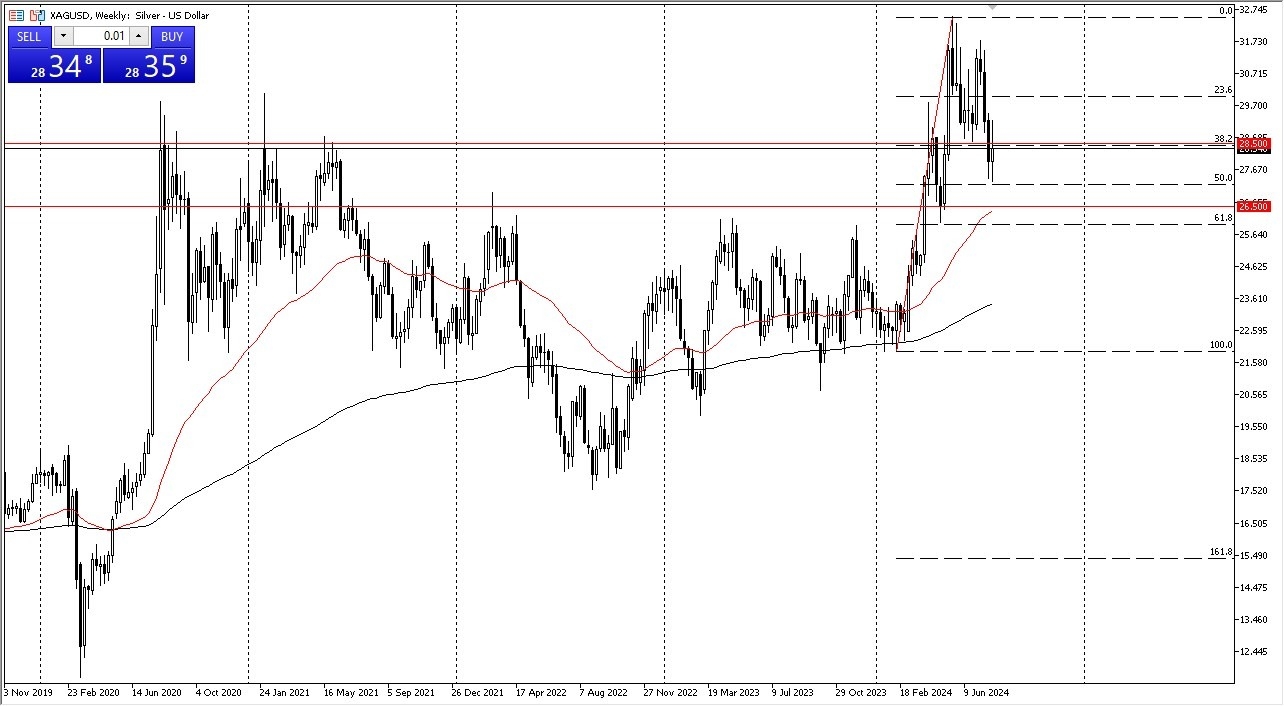
Similarly, silver fluctuated all over the place during the trading week. On Friday, it was extraordinarily volatile after the jobs report was released.
Ultimately, the silver market will likely continue to view the $28.50 level as a major area of inflection. I suspect that we are going to see a lot of noise at this juncture, due to the fact that there are a lot of questions being asked about the overall global economy. Because of this, I think there may be a lot of sideways, choppy price action ahead.
DAX
(Click on image to enlarge)
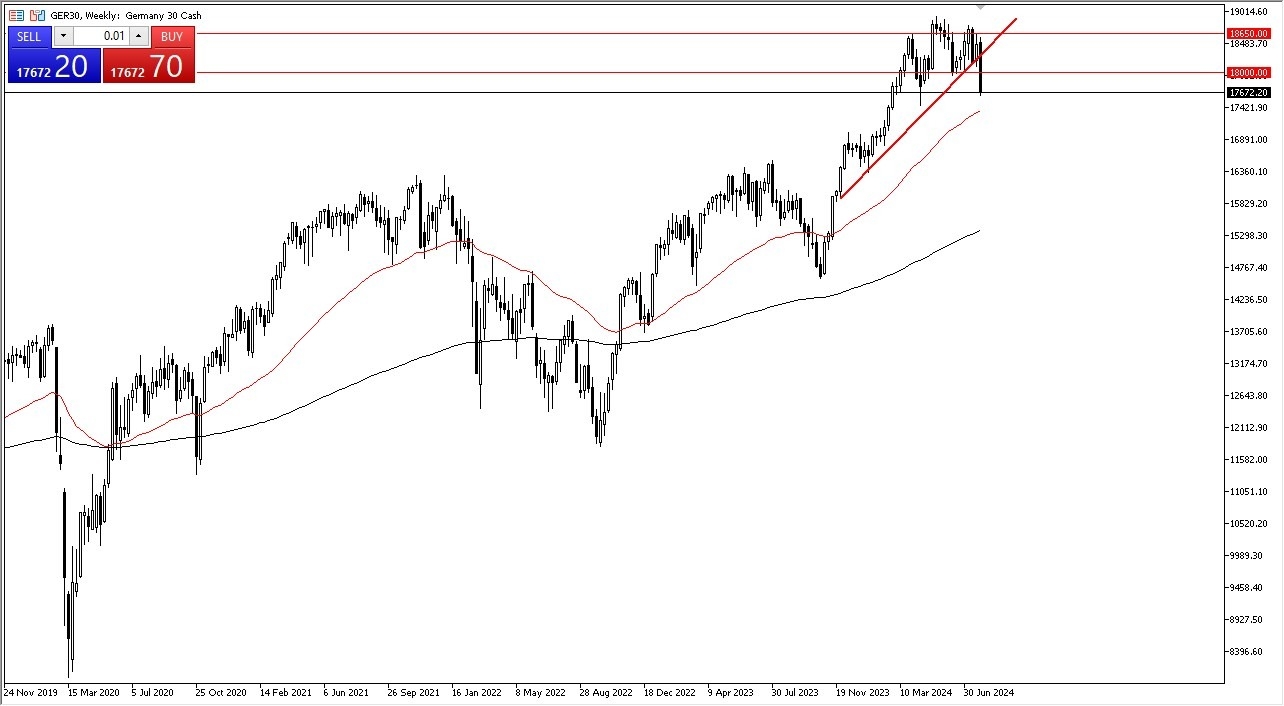
The German index appeared to be crushed during the week, as the European Union heads into uncertain economic waters. All things being equal, the size of the chart's candlestick does suggest that there may be a little bit of follow-through here, but the question now is whether or not we will see a break down below the EUR17,500 level.
If we do, such a move could spark a deeper correction toward the EUR17,100 level underneath. In order to become bullish, I would need to see the DAX break above the EUR18,000 level on a daily close.
GBP/CHF
(Click on image to enlarge)
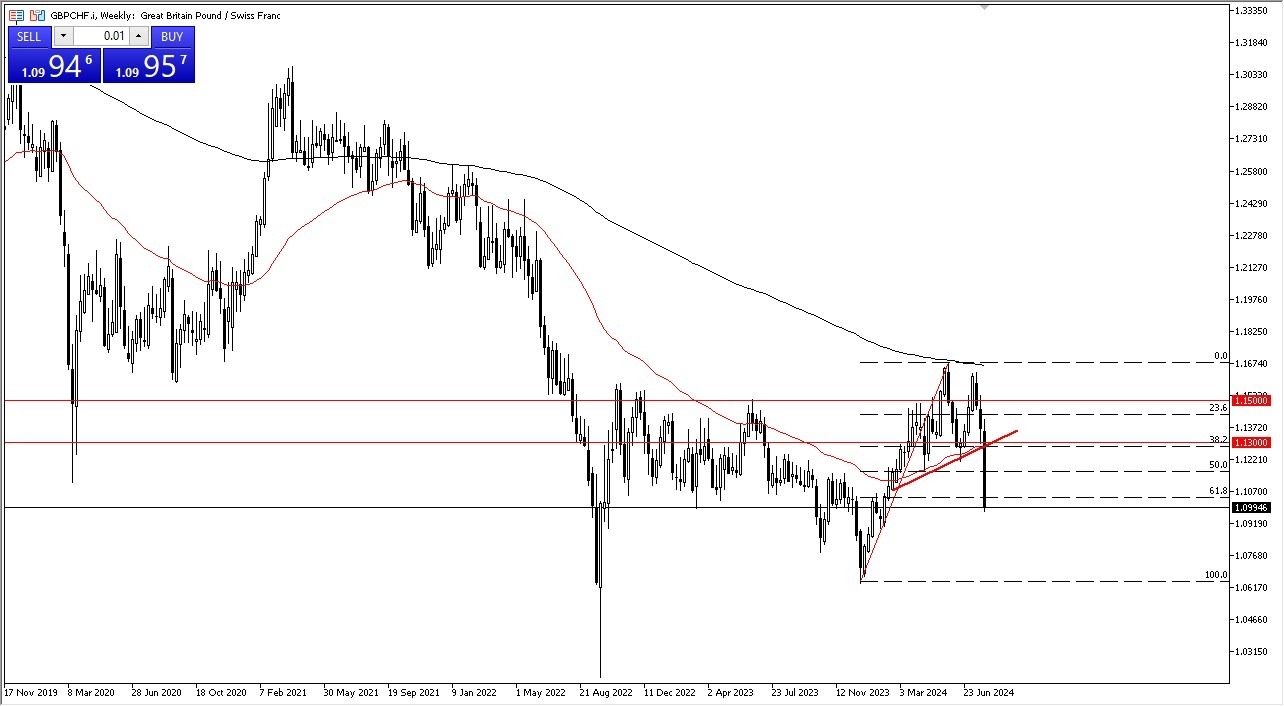
This past trading week was quite the brutal experience for one of my favorite carry trade pairs. The British pound initially tried to rally during the week, but it plunged lower, breaking through the 1.13 level before accelerating through an uptrend line.
At the end of the week, the market has been seen hanging around the 1.10 level, which is a large, round, psychologically significant figure. However, as the Bank of England cut rates, and it now looks as though the entire world is running toward safety, it appears that sellers will continue to have the upper hand, and each short-term rally will likely be sold into until something fundamentally changes.
WTI Crude Oil (US Oil)
(Click on image to enlarge)
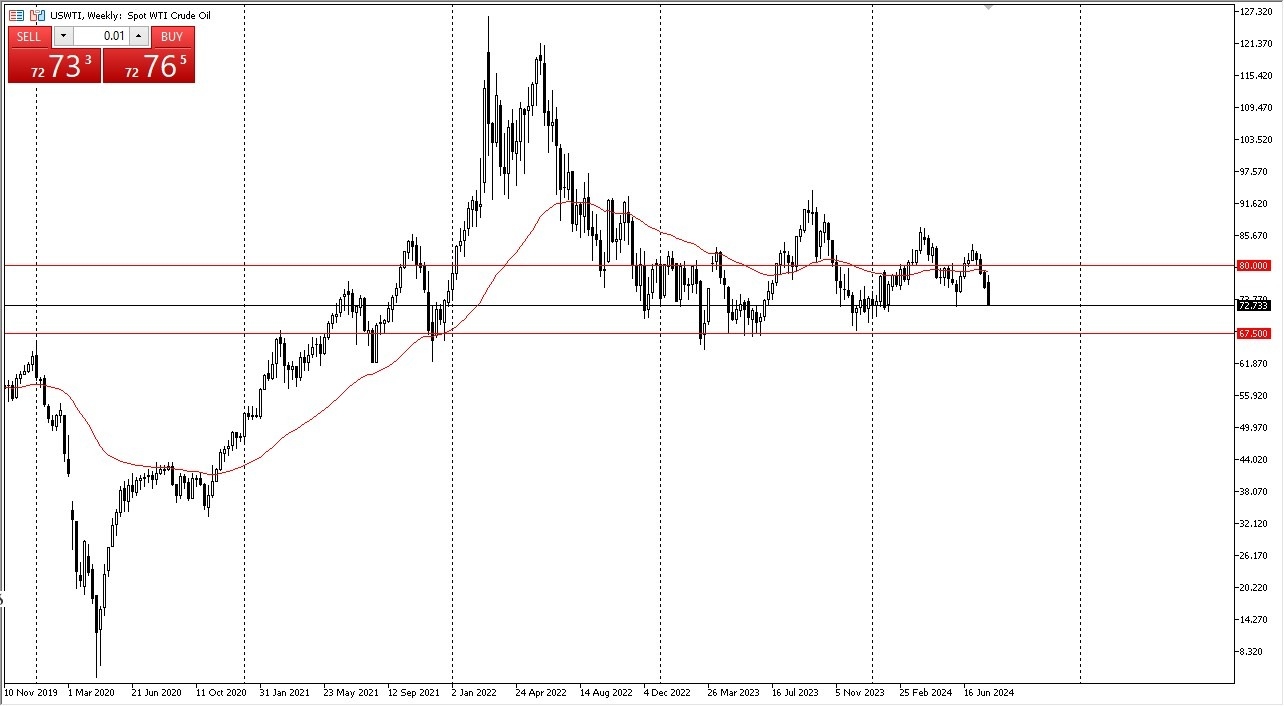
The crude oil market initially tried to rally during the week, but it then turned around to show signs of weakness. It plunged lower as OPEC has decided to keep production where it is, as some people were worried that OPEC would decide to cut output.
Furthermore, jobs numbers in America plummeted, and that has many people concerned. That being said, the downside is probably limited, as I see a massive support level at the $67.50 mark. There might be further selling, but the runway is somewhat limited for downward momentum.
EUR/GBP
(Click on image to enlarge)
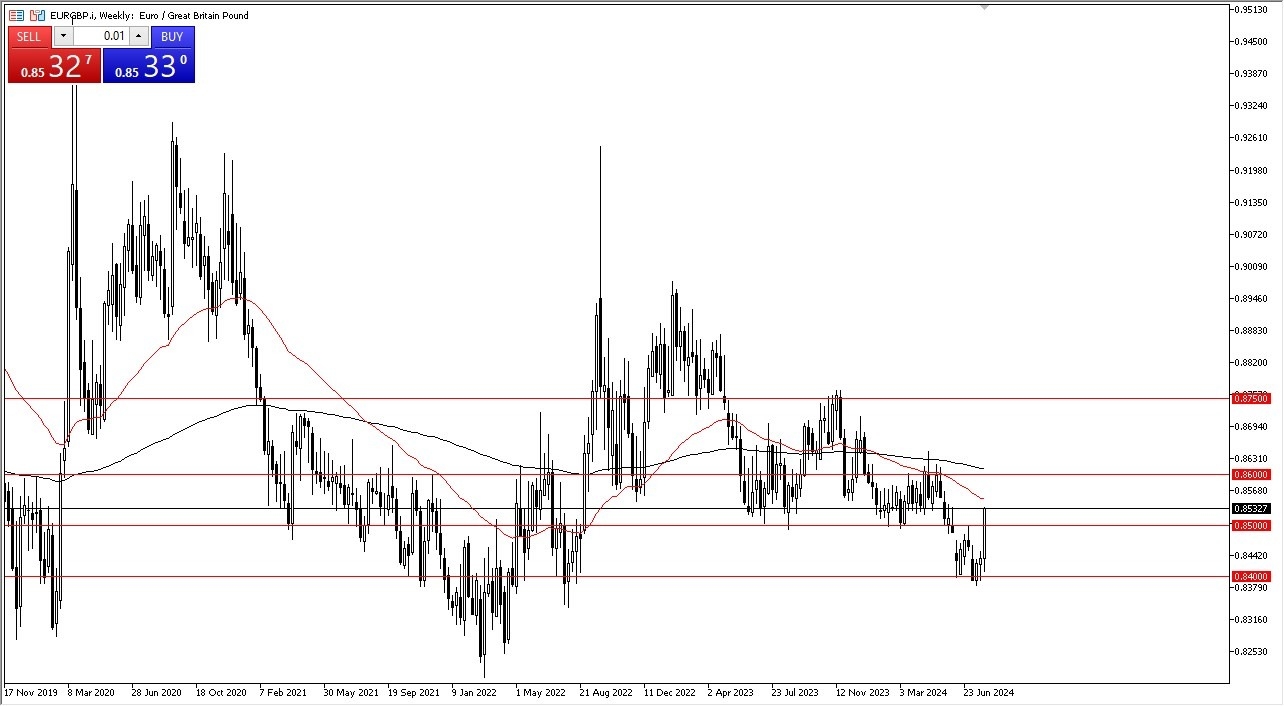
The euro exploded to the upside against the British pound during the week, and the Bank of England cut rates. The euro cleared through the crucial 0.85 level to show signs of real strength, and I think this space will eventually continue to go higher. Short-term pullbacks will almost certainly be a “buy on the dips” type of event.
Gold
(Click on image to enlarge)
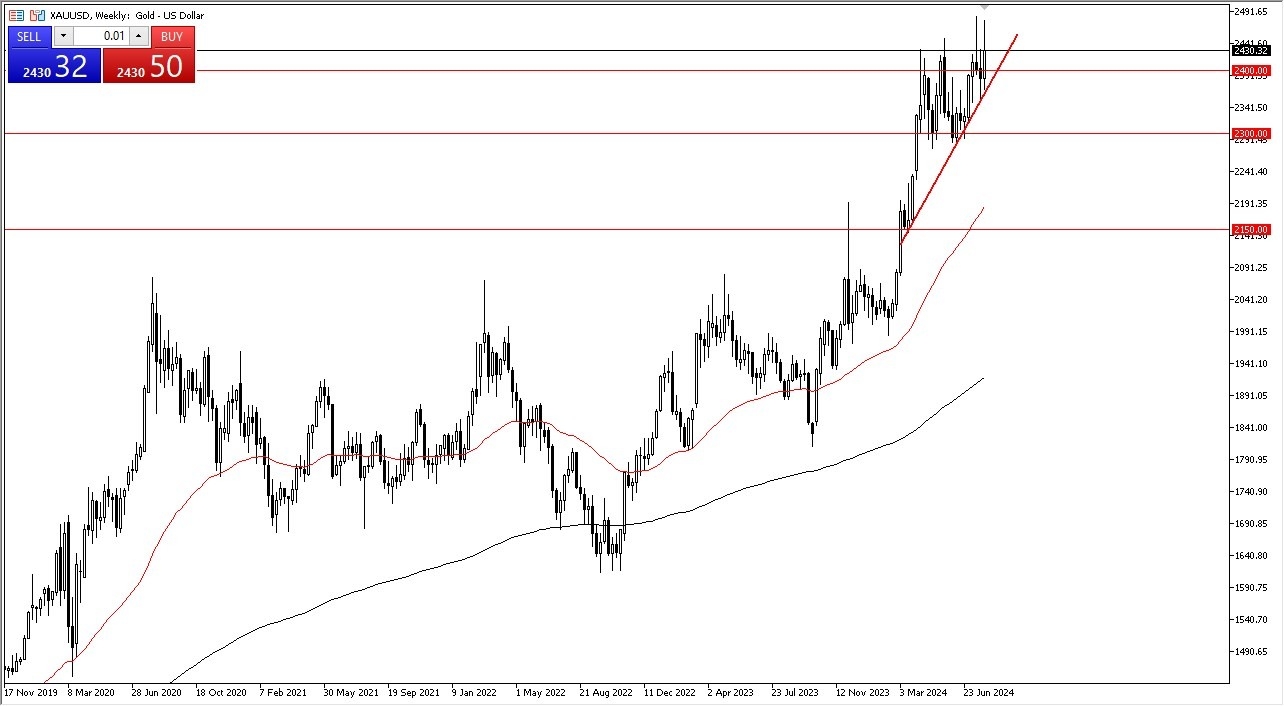
Gold markets were very bullish during the week, but they witnessed a lot of noisy behavior on Friday after the jobs numbers came out. Traders will have to keep in mind that although gold is very bullish, there is a lot of psychological resistance near the $2500 level. Short-term pullbacks should continue to offer buying opportunities.
Bitcoin
(Click on image to enlarge)
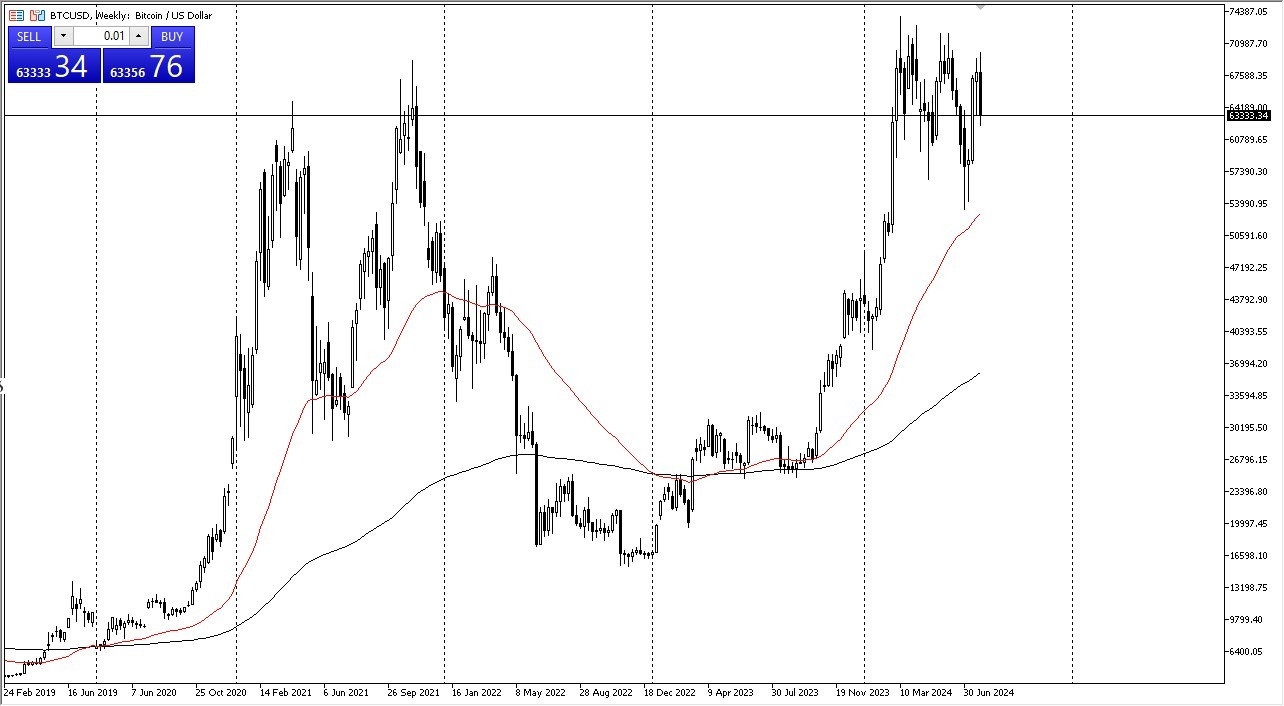
Bitcoin initially tried to rally during the week, but it then fell rather hard, slamming into the $63,000 level. I think this market will continue to see a lot of volatility, but I do see a lot of support resting underneath.This will likely remain a “buy on the dips” type of market, and I think there may be some opportunities to pick up a few cheap coins ahead.
That being said, it’ll be interesting to see how this space plays out, because it almost seems like the connection between Bitcoin and technology stocks resumed on Friday.
More By This Author:
GBP/JPY Forecast: Looking To BounceCrude Oil Forecast: Continues To Follow A Bigger Triangle Pattern
GBP/JPY Forecast: Pound Gets Crushed Against The Yen
Disclaimer: Mr. Christophe Barraud could not be held responsible for the investment decisions or possible capital losses of users. Mr. Christophe Barraud endeavors to provide the most accurate ...
more

