Pairs In Focus - Sunday, Aug. 25
Image Source: Unsplash
FTSE 100
(Click on image to enlarge)
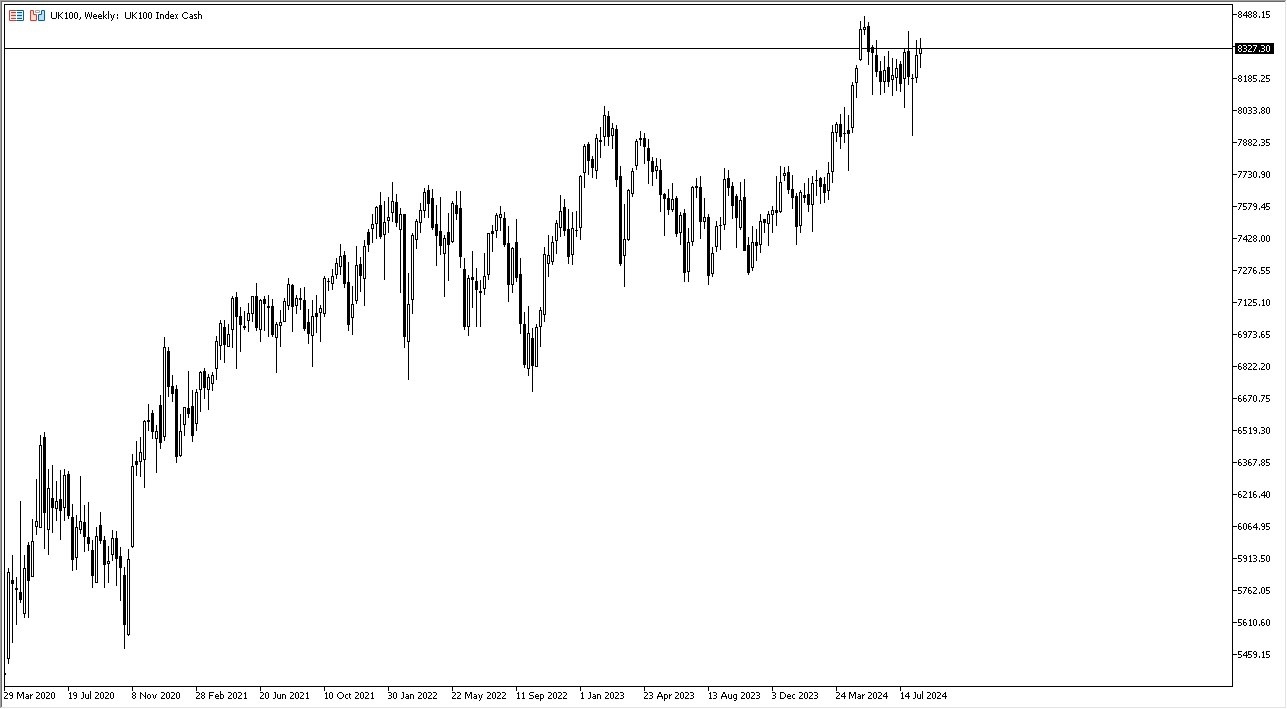
The FTSE 100 initially pulled back during the week, but it looks to still have plenty of support underneath. Due to the fact that it turned around to bounce, along with the potential of central banks stepping in to provide liquidity, I suspect that we will continue to see many stocks rally in the short-term. As long as the FTSE 100 can stay above the 8100 level, I think the market can move higher.
USD/CHF
(Click on image to enlarge)
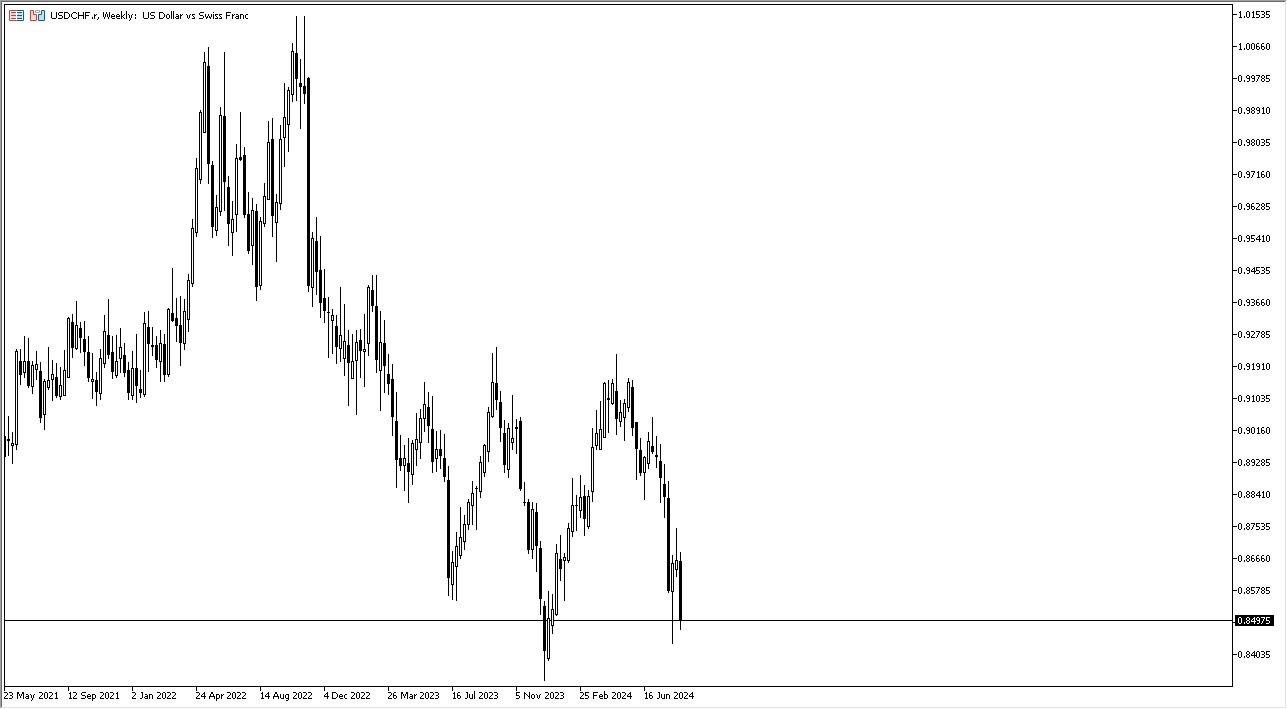
The US dollar dropped rather significantly during the course of the week, as it appeared to be testing the 0.85 level. This is an area that had previously been support, and it’s interesting to see it here again.
Jerome Powell stated on Friday that the Federal Reserve is likely to cut rates, and that has put some downward pressure on the US dollar. That being said, it is still a positive swap. I think we will probably see a bounce sooner rather than later. All things being equal, if the dollar could break above the top of the weekly candlestick, I think the market could then go looking to the 0.91 level above.
NZD/USD
(Click on image to enlarge)
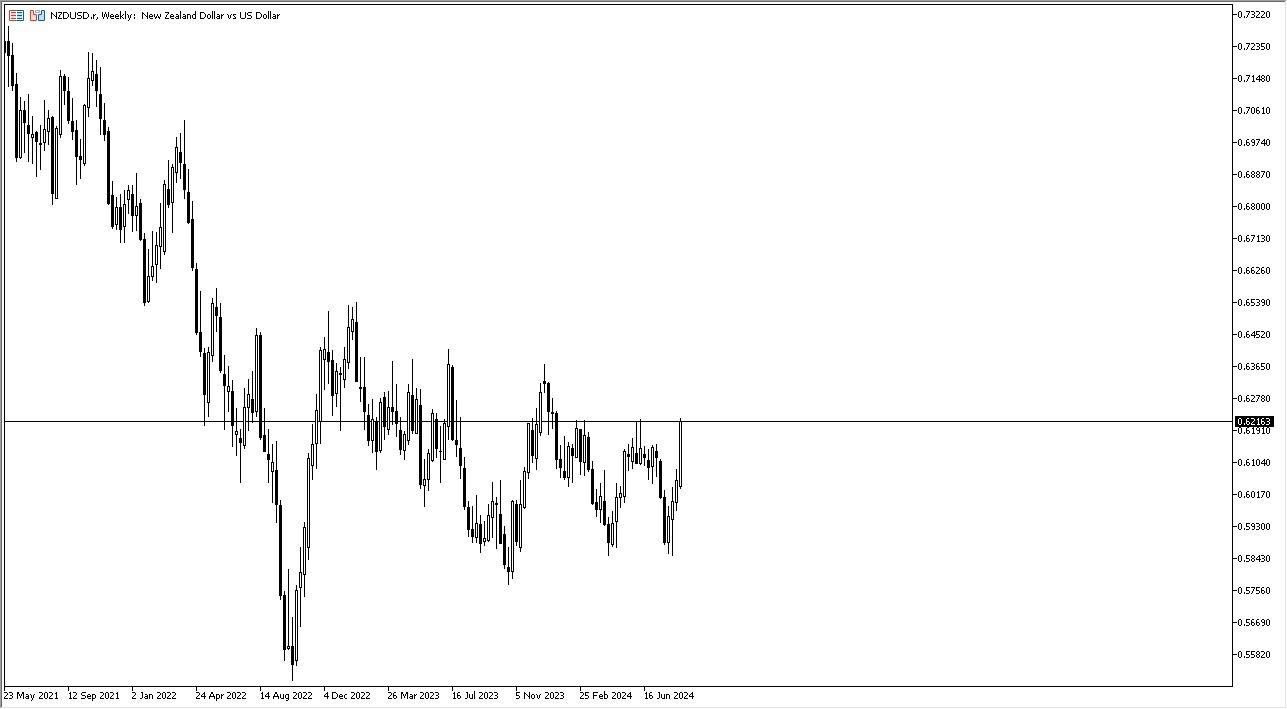
The New Zealand dollar rocketed higher during the course of the week, as it prepared to break above the 0.62 level. If the NZD/USD market manages to move higher, I think the market could even reach to the 0.6350 level. The size of the candlestick seems to suggest that there is a lot of pressure to the upside here, and we could see the US dollar take it on the chin due to the Federal Reserve almost certainly cutting rates over the next several months.
EUR/USD
(Click on image to enlarge)
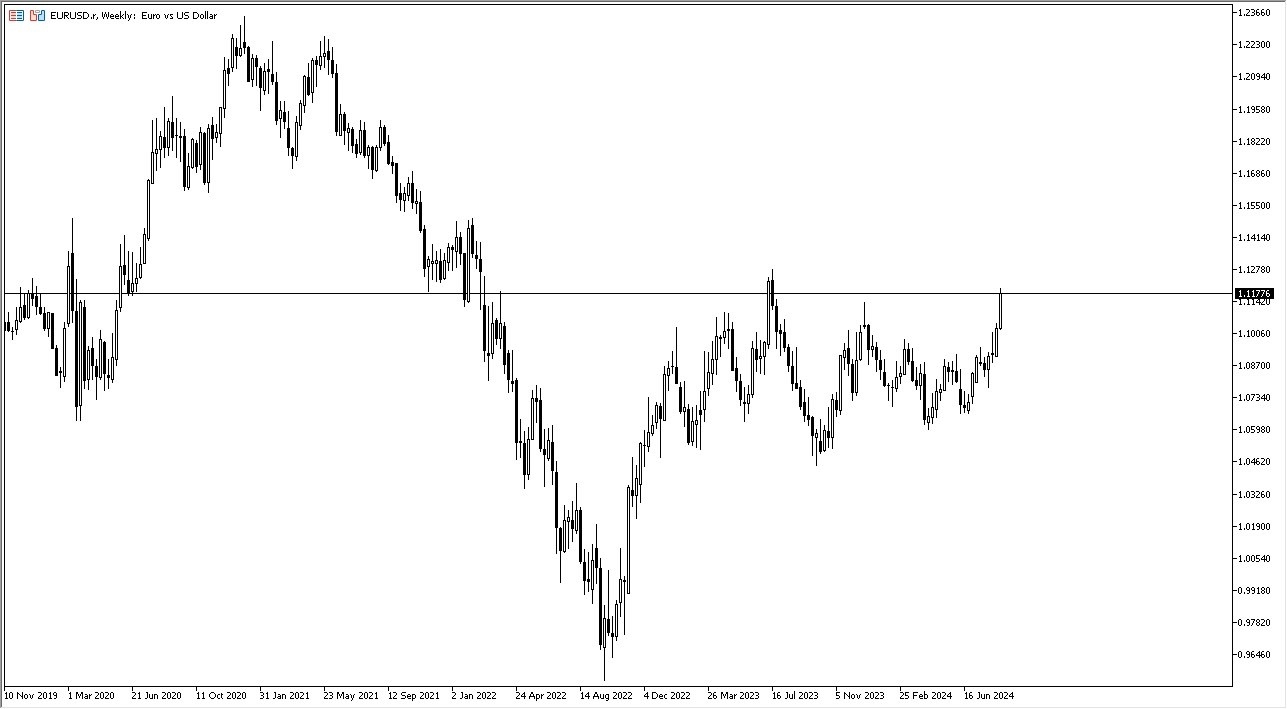
The euro rallied rather significantly during the course of the week against the US dollar, as Jerome Powell has reported that the Federal Reserve is going to cut rates. The 1.1250 level above may offer significant resistance, as it was previous support.
If the EUR/USD market shows signs of weakness in the coming days, then I think the pair could likely pull back toward the 1.11 level. At this point, I’m not a huge fan of the euro.
Gold
(Click on image to enlarge)
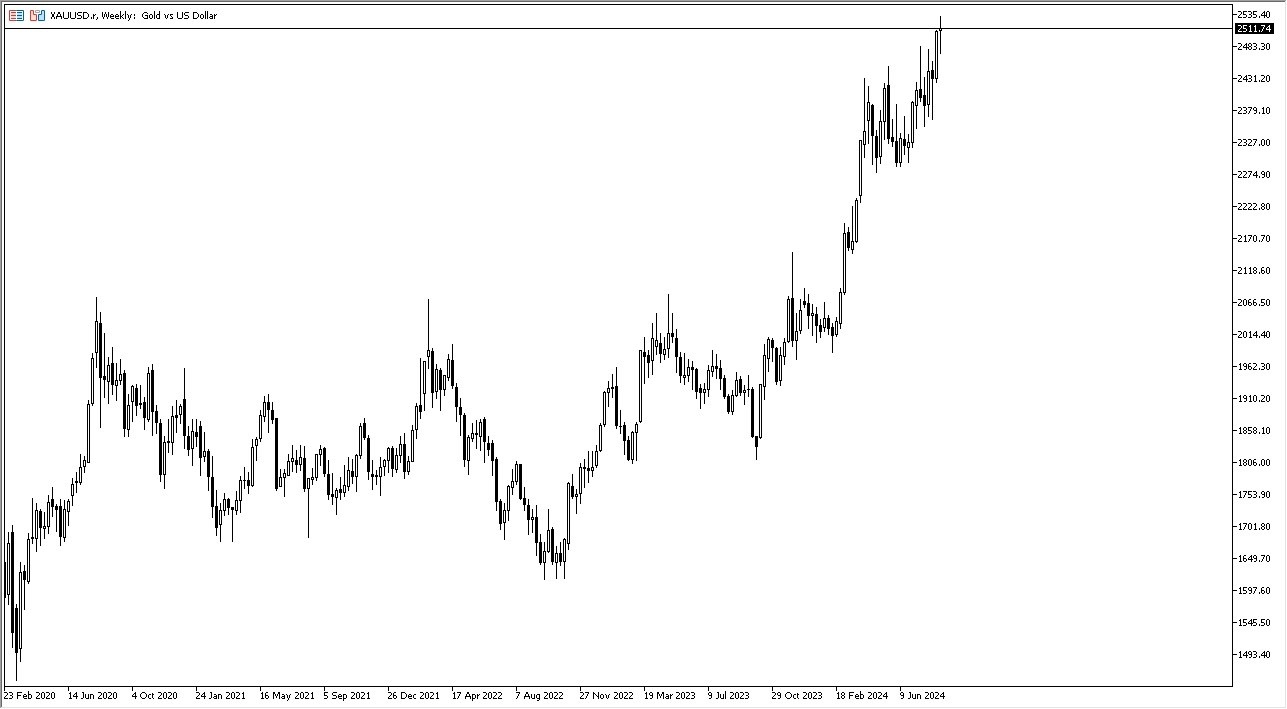
Gold markets moved all over the place during the week, but Friday especially saw quite a bit of noisy behavior. At this point in time, it looks like gold will continue to hang around the $2500 level. This is an area that is a large, round, psychologically significant figure.
As previously mentioned, the Federal Reserve is going to cut rates, and that has a lot to do with what gold does going forward. It certainly looks positive at this point in time.
ASX 200
(Click on image to enlarge)
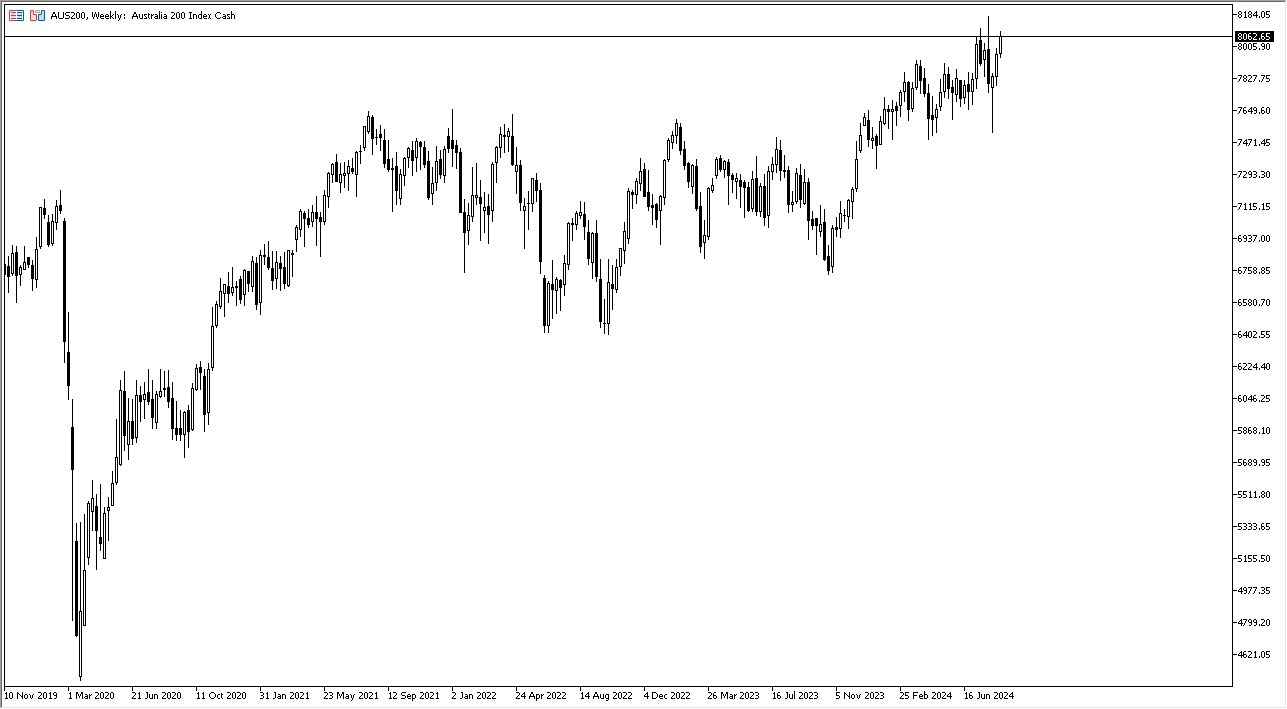
The Australian Stock Exchange 200 rallied during the course of the week as it continued to threaten the AUD8100 level. This looks like a short-term pullback just waiting to happen, but that pullback should be thought of as a potential buying opportunity.
All things being equal, this is a market that looks very bullish. Even if we do see it pull back a bit, I think that there would be plenty of buyers out there willing to get involved.
USD/JPY
(Click on image to enlarge)
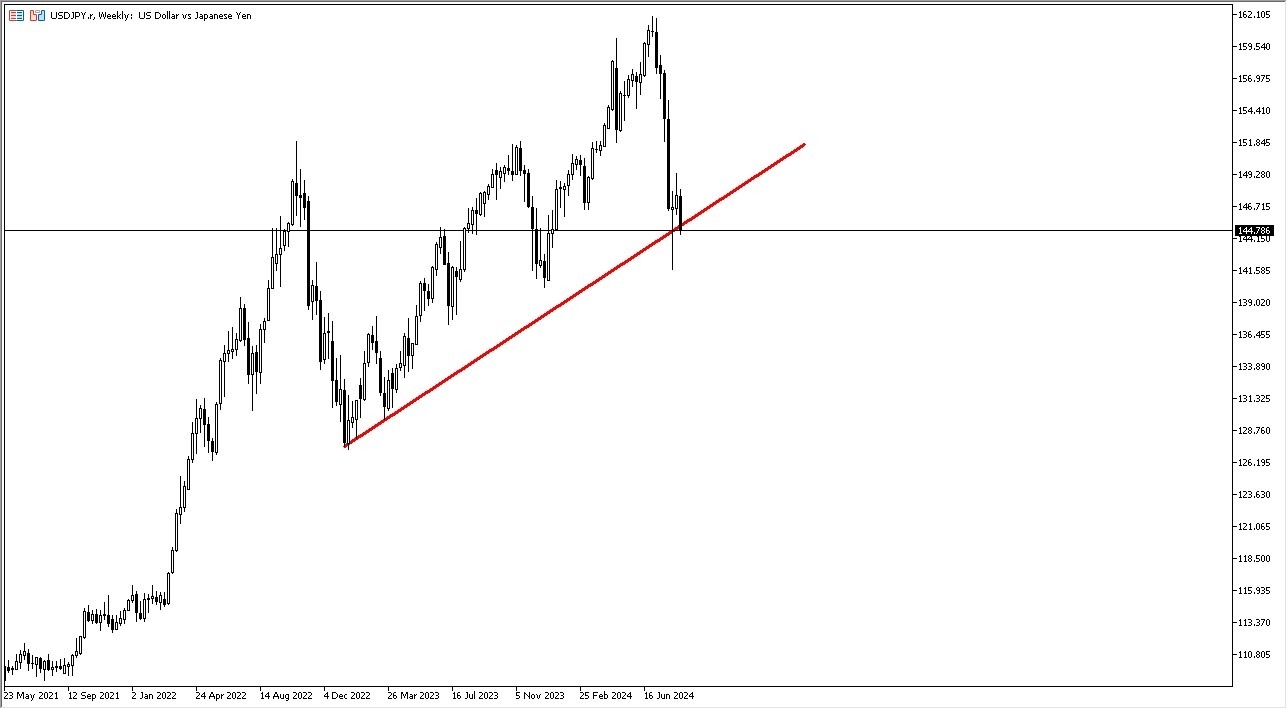
The US dollar plunged against the Japanese yen during the course of the week. This is a market that you need to watch very closely. If we were to see a break below the hammer from the candlestick two weeks ago, then I think this pair would truly fall apart.
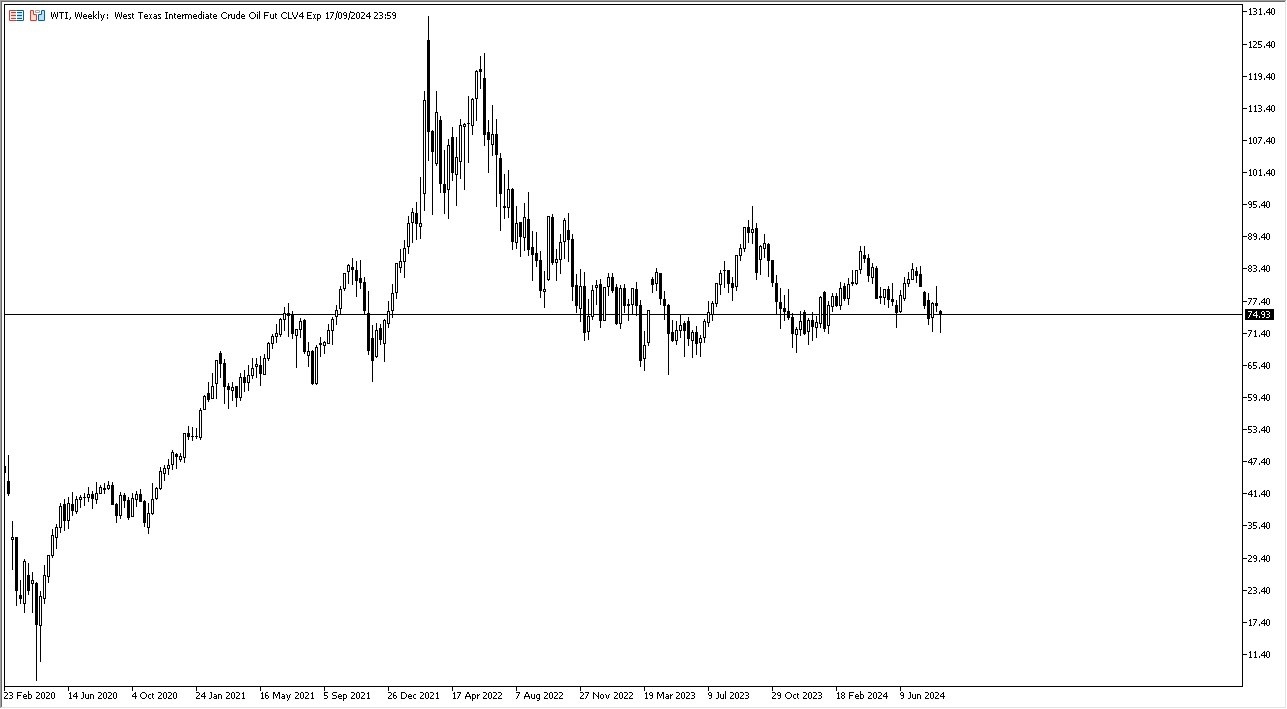
WTI Crude Oil
(Click on image to enlarge)
The crude oil market pulled back a bit to show signs of weakness before it bounced from the crucial $71.50 level. This is an area that has been significant support. Given the fact that it ended up forming a bit of a hammer, I think the market is likely to go higher. At this point, it’s possible that crude oil could go looking to the $80 level above, which is a large, round, psychologically significant figure, and a bit of a barrier.
More By This Author:
Natural Gas Forecast: Plummets After Inventory NumbersBTC/USD Forecast: Resistance At $62,000 Looms
S&P 500 Forecast: Stretched Ahead Of Meeting Minutes

