

Image Source: Unsplash
EUR/USD

(Click on image to enlarge)
The euro spent the majority of the last week rising, as it broke above the 1.10 level and reached the 1.1050 mark before it pulled back. At the end of the week, it looks to be hanging around that 1.10 level again. It may continue to move back and forth.
That being said, the EUR/USD market often spends most of its time going from one large, round figure to another, and I think that will continue to be the case going forward.
Nasdaq 100

(Click on image to enlarge)
The Nasdaq 100 similarly spent the entirety of the week rising. At the end of the week, the index seems to be finding itself challenging the 19,500 level. This was preceded by a massive hammer, which is a bullish sign.
With that being said, it looks like buyers will continue to come back into the Nasdaq 100 on dips. If we do see a break higher, the 20,500 level would likely end up being the target. I have no interest in trying to short this market anytime soon.
Silver

(Click on image to enlarge)
Silver spent the majority of the week going higher, as it reached the crucial $28.50 level. We have since seen it break above there, and it now looks as though the silver market could continue going much higher, perhaps even reaching the $31 level.
All things being equal, this is a market that I think will continue to offer a lot of buying opportunities on short-term dips, and therefore I think we have a situation where silver will continue to attract a lot of attention, especially if traders start to hang on to the idea that the Federal Reserve is going to aggressively cut rates.
DAX

(Click on image to enlarge)
The German index spent most of the week rallying. As it approaches the close of the weekend, it appears to be testing the bottom of the previous uptrend line.
That being said, it seems like traders have come back into the market and started taking more risks, and that means that market participants likely believe that the central banks are going to step in. At this point, I would anticipate that the DAX could see a little bit of a pullback, but as long as it can stay above the EUR18,000 level, it’s very likely that the index could continue to go higher, perhaps eventually reaching the EUR18,650 level.
WTI Crude Oil

(Click on image to enlarge)
The crude oil market rallied in the early half of the week, but it now looks as though the 50-week EMA is going to offer resistance. The $80 level above is a large, round, psychologically significant figure. If crude oil can break above there, such a move would obviously be very bullish. However, based upon the action seen this past week, it’s very likely that the market is going to remain somewhat sideways in general.
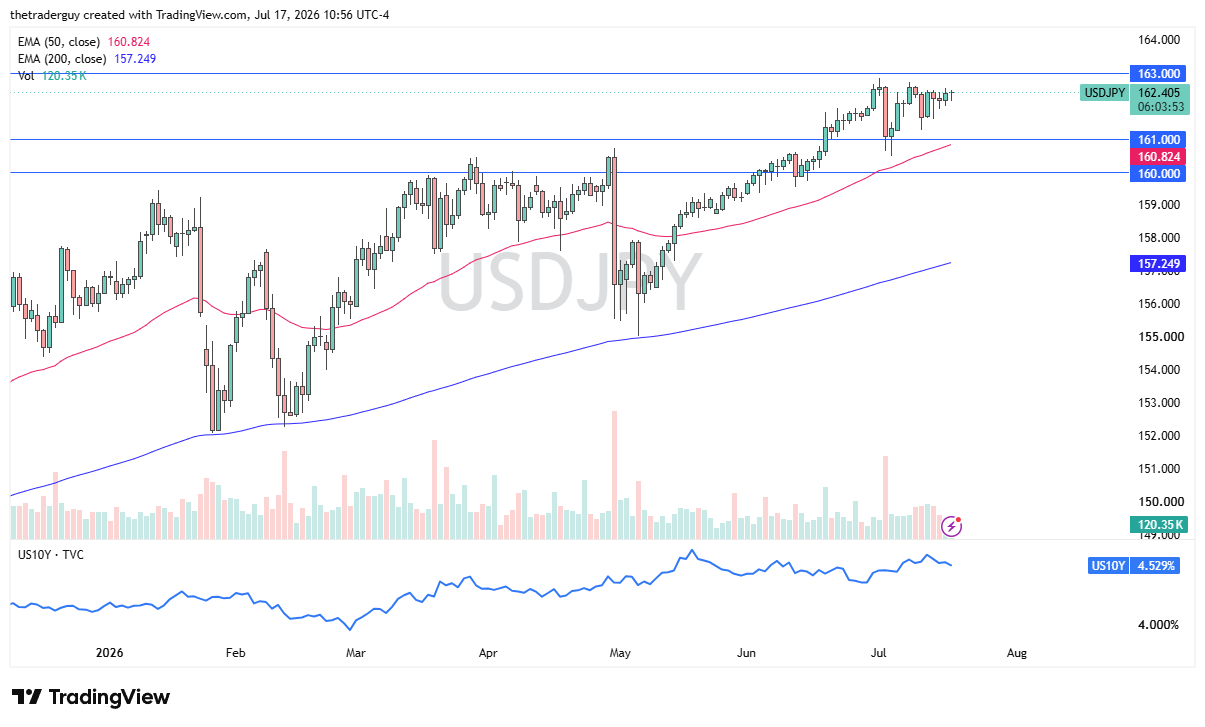
USD/JPY

(Click on image to enlarge)
The US dollar rallied rather significantly during the trading week before it slammed into the previous trendline from underneath and showed signs of resistance. It now looks as if the JPY150 level is going to be significant resistance, especially as the 50-week EMA sits in that same area.
If we were to see a break above that level, then I think it would be possible to see the US dollar going higher. That being said, it moved back and forth over the last couple of sessions, and it seems to be at a major point of inflection. Therefore, it’s likely that we will continue to see choppy behavior in this space.
Dow Jones 30

(Click on image to enlarge)
The Dow Jones 30 experienced a very strong week, as it broke well above the 40,500 level to show signs of life again. This is a market that has a lot of support underneath, and it looks ready to go higher, perhaps even to the 4100 level.
Short-term pullbacks at this point in time will likely continue to offer value opportunities. As long as the Dow Jones 30 stays above the hammer from the previous week, it’s likely that we will continue to see buyers jumping in.
GBP/CHF

(Click on image to enlarge)
The British pound rallied rather significantly during the course of the trading week against the Swiss franc, as it broke through the top of the candlestick from the previous week, which was a hammer.
It looks like the British pound is trying to reach the CHF1.13 level, and a break above that point would confirm higher price action. That being said, it seems to be a little bit overextended, so I think a short-term pullback is likely.
More By This Author:
BTC/USD Forecast: Bounces From 200 Day EMAEUR/USD Forecast: Continues To See Noisy Trading
BTC/USD Forecast: Questions of Risk Appetite


Comments
Log in or sign up to join the conversation.