Pairs In Focus - Sunday, April 27
Image Source: Unsplash
USD/JPY
(Click on image to enlarge)
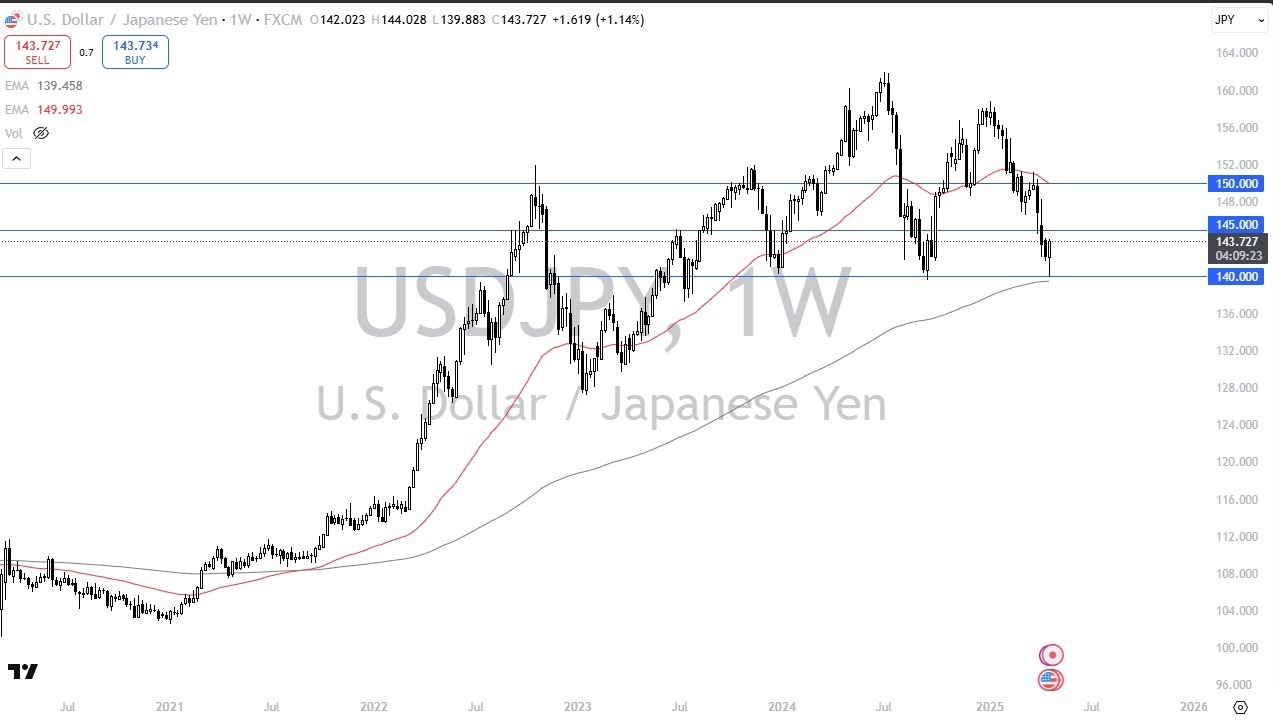
The US dollar initially fell against the Japanese yen during the week, but it eventually found enough support near the JPY140 level to turn things around and bounce quite significantly. It’s interesting, because the JPY140 level has been a major support level going back some time now, and it’s also worth noting that the 200-week EMA sits there as well.
By forming this massive hammer, and the fact that some of the rhetoric out there has gone off the rails, it’s starting to look more and more like the US dollar is in the process of bottoming. Furthermore, the Japanese yen looks like it may be giving up some of that strength.
USD/CHF
(Click on image to enlarge)
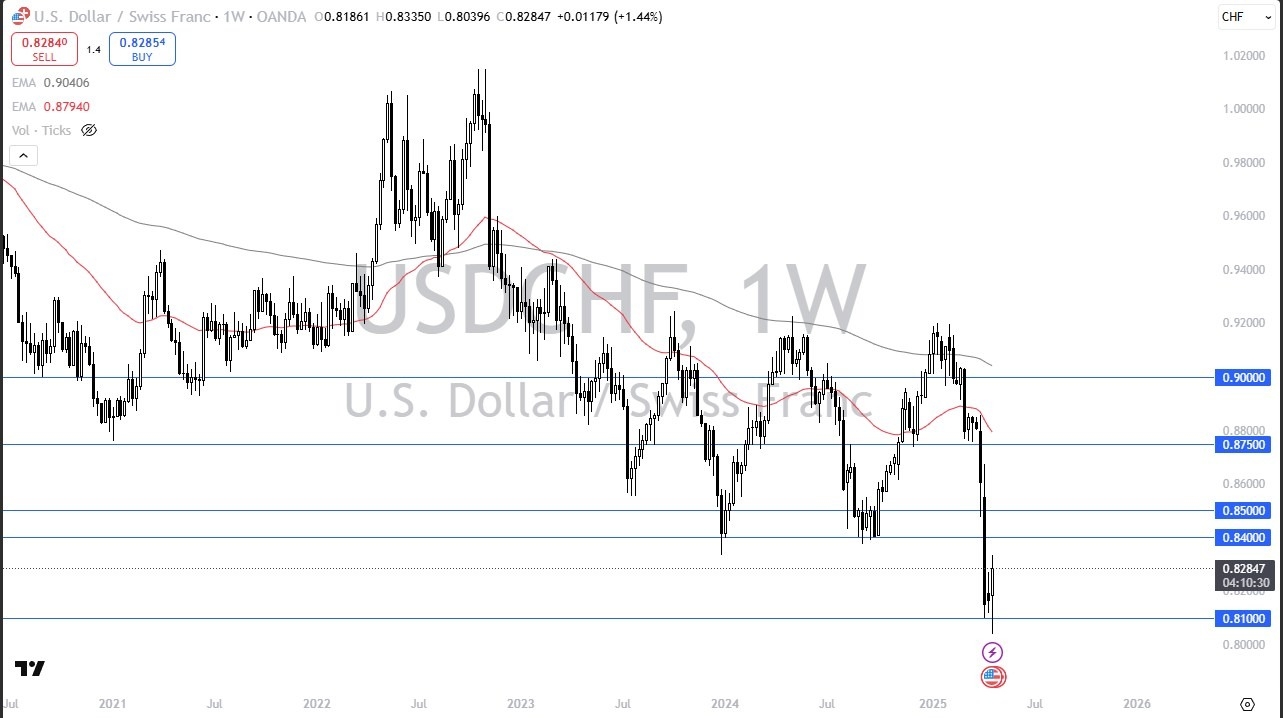
The US dollar initially fell during the course of the week to break down below the 0.81 level, only for it to turn around and bounce all the way toward the 0.83 level. The US dollar looks like it is ready to rally from here, but whether or not it can change the overall trend is a completely different question.
If it can break above the 0.84 level, then I think such a move could push it up even further, perhaps toward the 0.8750 level. However, if things turn around and a breakdown occurs below the weekly candlestick, then it could drop down to the 0.80 level eventually.
GBP/USD
(Click on image to enlarge)
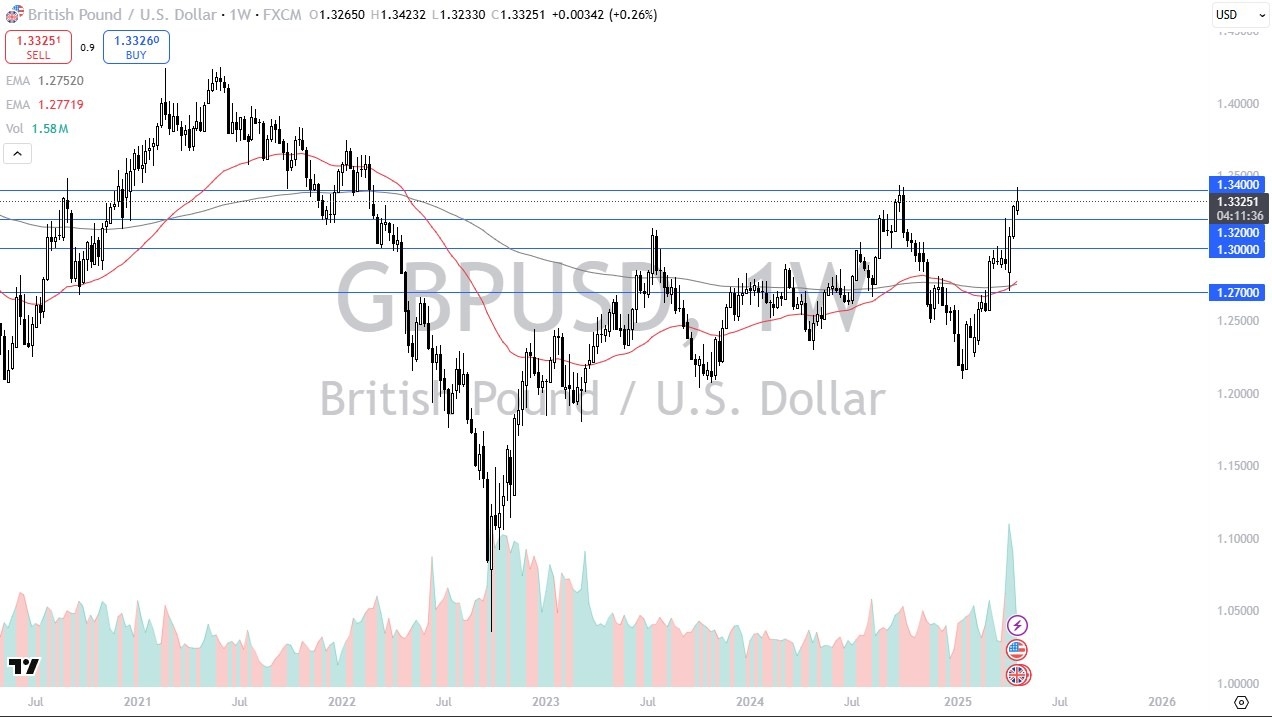
The British pound rallied significantly during the course of the week, but it found the 1.34 level to be far too resistant to continue its stride. In doing so, it ended up forming a bit of a shooting star. This is a market that appears to be overbought, so a pullback does make quite a bit of sense at this point in time.
In fact, I am seeing this across the board when it comes to the US dollar, so I think all things are leading to the same scenario -- one where the greenback suddenly strengthens. That being said, this doesn’t necessarily mean that the British pound will fall apart. If we were to see a break above the 1.34 level on a weekly close, then things could really start to accelerate to the upside.
EUR/USD
(Click on image to enlarge)
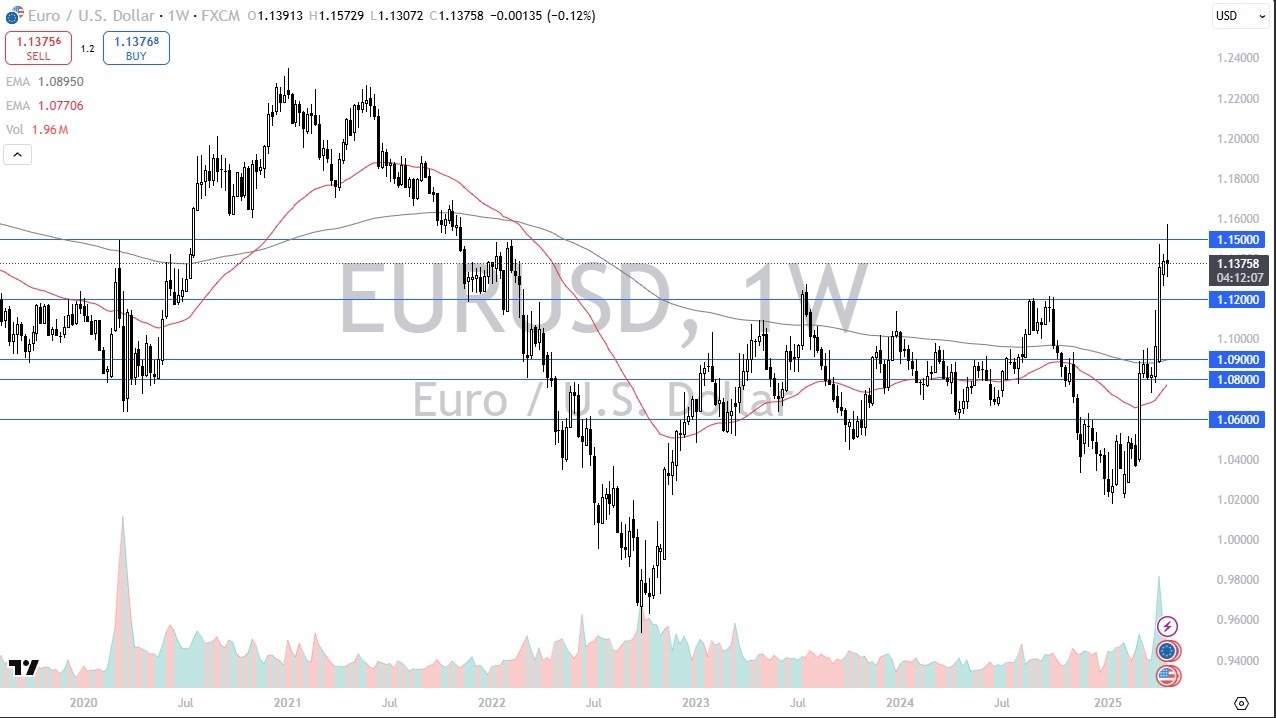
There are a few charts out there that suggest exhaustion is increasing when it comes to selling the US dollar. This is not exactly one of those charts. I believe that the 1.15 level will continue to be a large, round, psychologically significant figure.
By forming a massive shooting star, it’s likely that we could see it drop from here and go down to the 1.12 level. A break below the 1.12 level could see the US dollar start to pick up strength across the board.
Gold
(Click on image to enlarge)
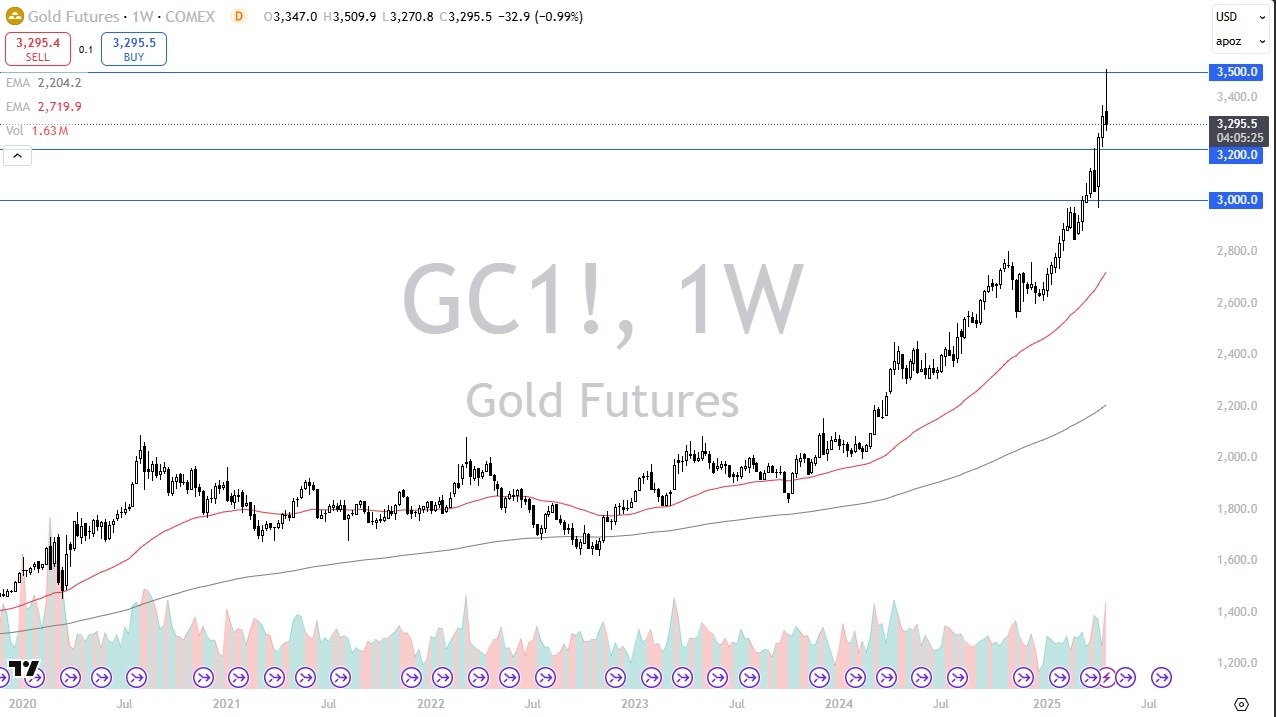
Gold markets initially launched higher during the trading week, but it managed to hit the $3500 level during the Asian trading session. The $3500 level ended up forming a shooting star, which seems to suggest some exhaustion. Therefore, it would not surprise me to see the gold market drop toward the $3200 level.
After that, it could even drop all the way to the $3000 level. That being said, the market is going to be paying close attention to the US dollar, and gold has only demonstrated what previous charts have already shown: that the US dollar is oversold.
WTI Crude Oil
(Click on image to enlarge)
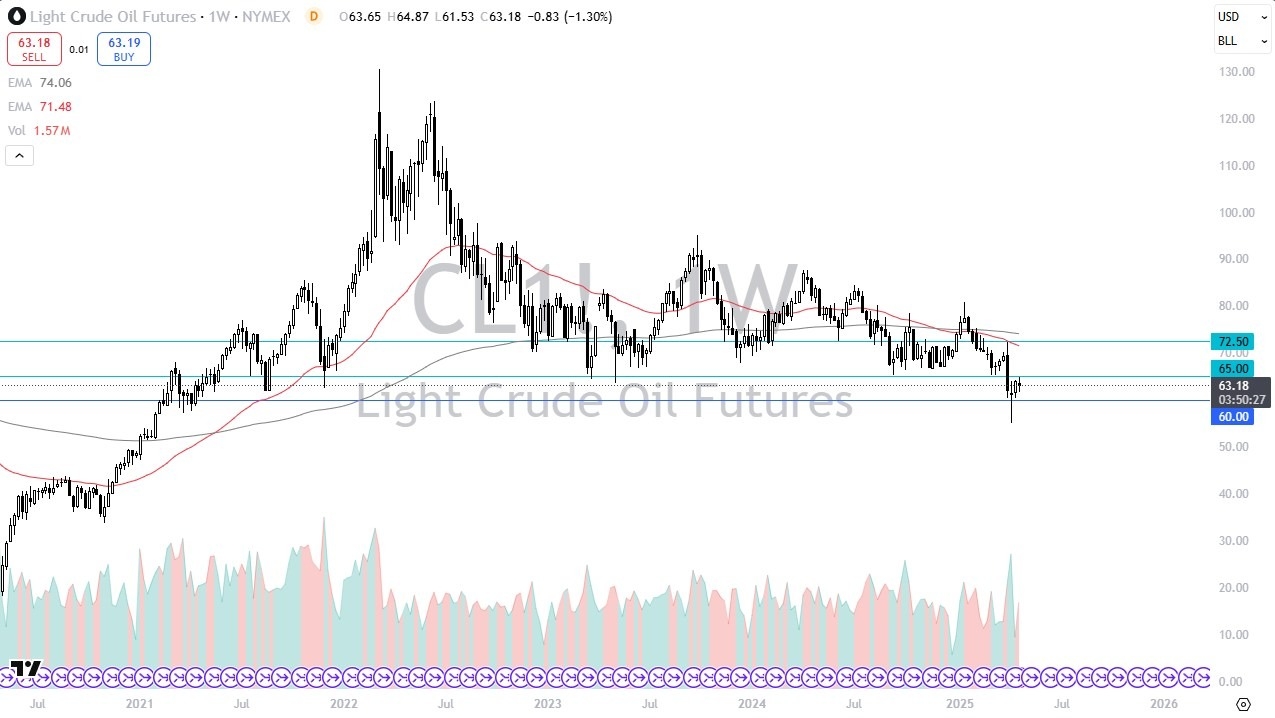
Crude oil moved back and forth during the week, as it continued to build some type of basing pattern. At this point, it makes sense that the space has seen mostly sideways movement, but the key to seeing more gains in the crude oil market will likely be the $65 level.
If crude oil can break above there, then some 'fear of missing out' trading could enter the market. One thing that could be a major boon for the oil market is if we see some type of resolution to the tariff situation around the world.
DAX
(Click on image to enlarge)
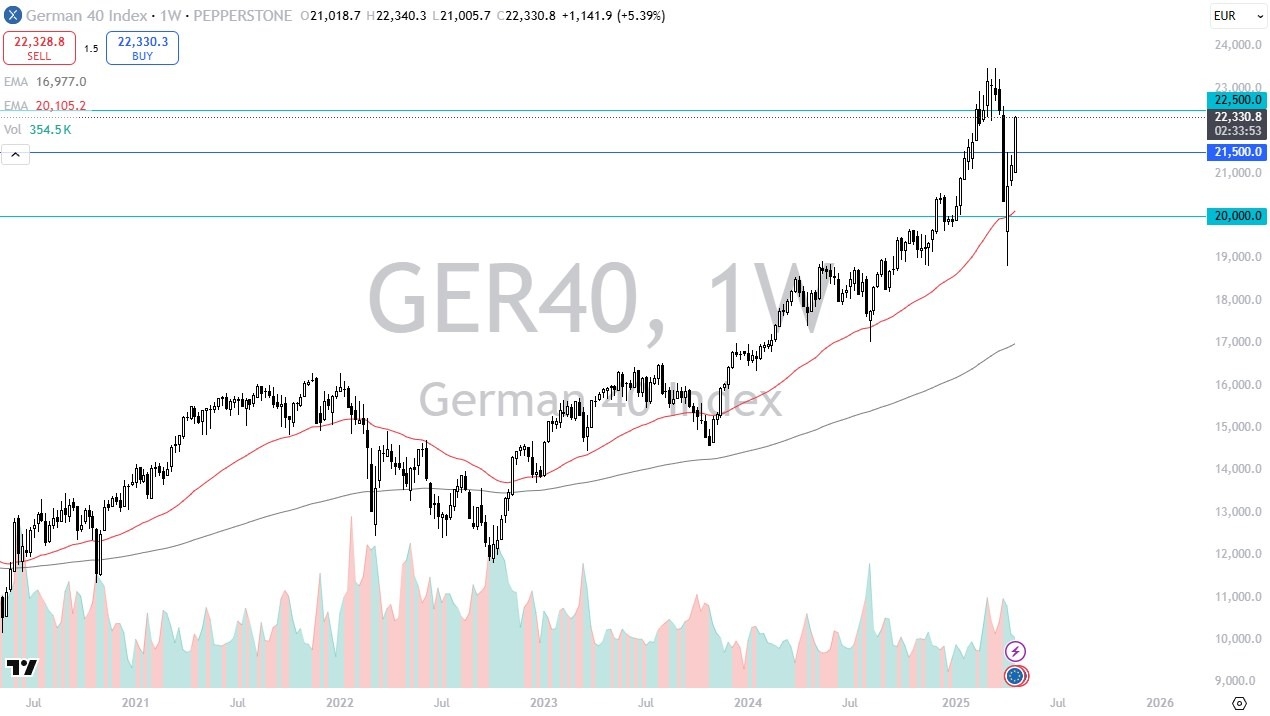
The German index shot straight up in the air like a rocket over the last week, as stocks started to see more positive sentiment. The index now faces the challenge of the EUR22,500 level, but with the massive amount of momentum that we have seen to the upside, it would not surprise me to see this market pull back a bit in order to find enough value to eventually continue higher.
Nasdaq 100
(Click on image to enlarge)
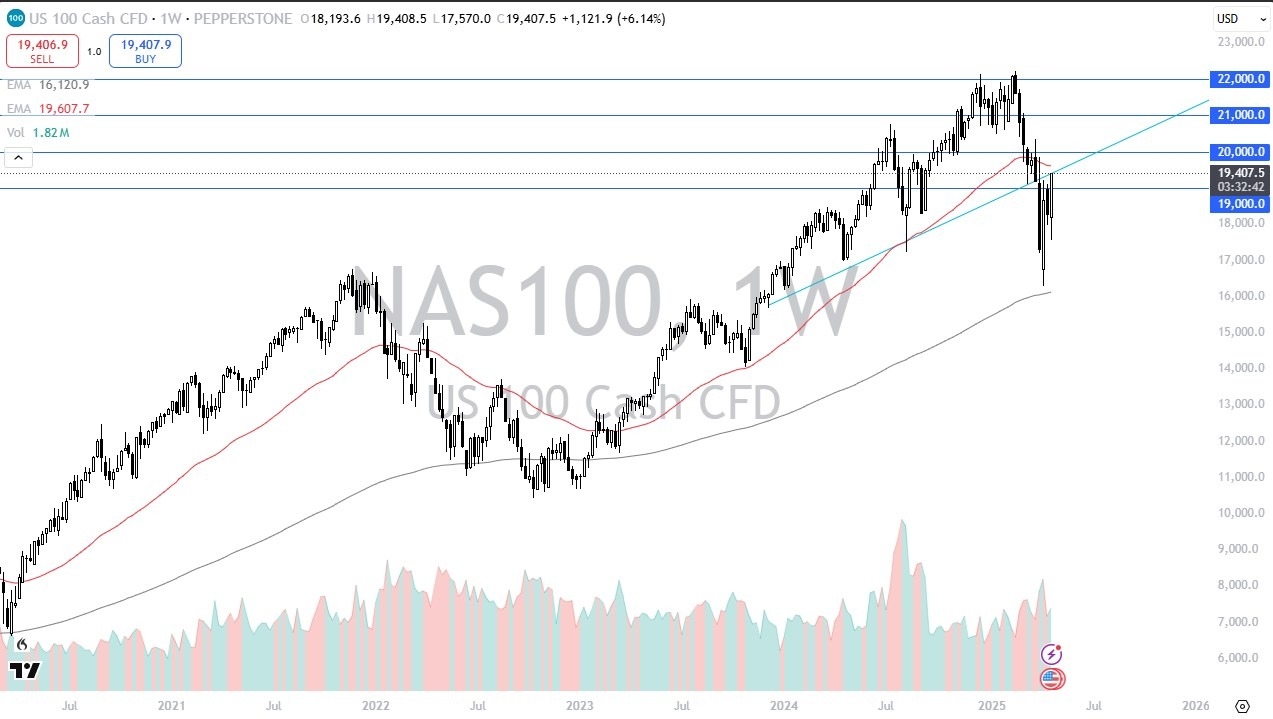
The Nasdaq 100 similarly rocketed higher during the week, but it now appears to be testing a previous uptrend line. Additionally, the 50-week EMA sits just above that point. At this point in time, it looks like Wall Street could be expecting some type of trade deal. Short-term pullbacks should continue to attract attention in a potential “buy on the dip” market.
More By This Author:
Nasdaq Forecast: Eyes Breakout After Bullish SurgeUSD/JPY Forex Signal: Struggles To Build Momentum
USD/CAD Forecast: Attempts To Find A Bottom
Disclosure: DailyForex will not be held liable for any loss or damage resulting from reliance on the information contained within this website including market news, analysis, trading signals ...
more

