Pairs In Focus - Sunday, April 21

Image Source: Pixabay
Silver
(Click on image to enlarge)
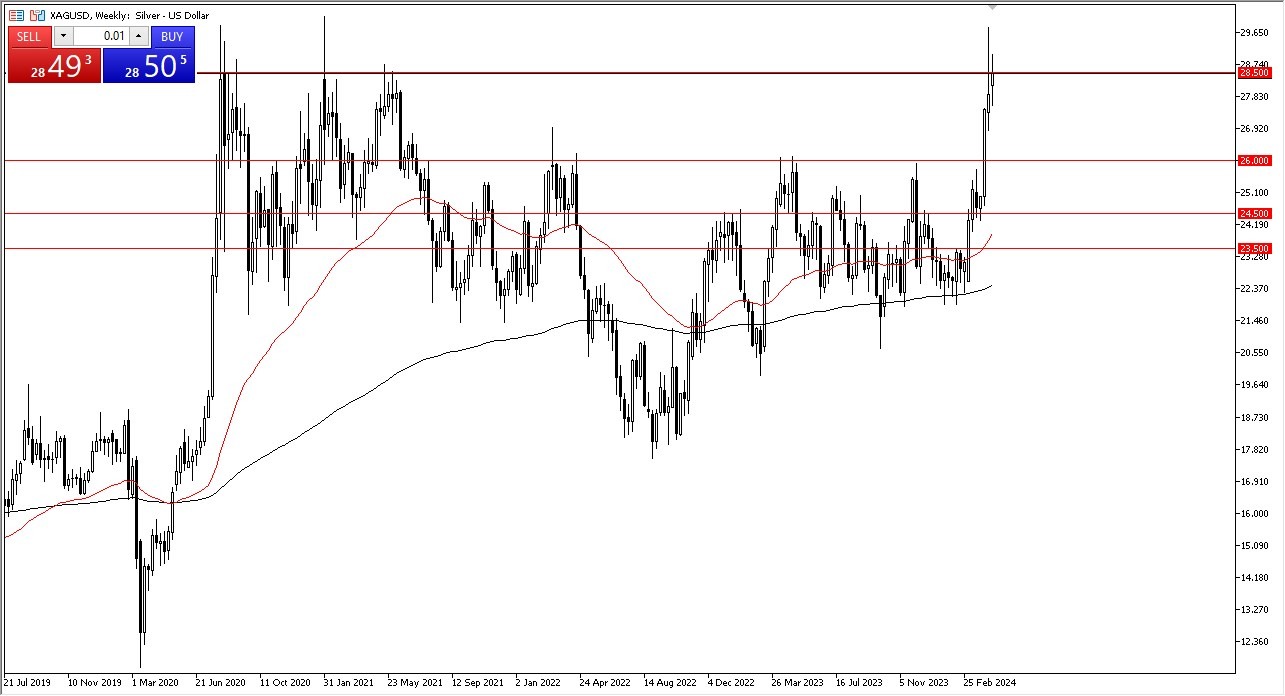
Silver experienced yet another volatile week, but the thing that I am paying the most attention to right now is the fact that the $28.50 level continues to be a major barrier. Between the $28.50 level and the $30.00 level, there is a significant amount of selling pressure, as we have seen multiple times over the years.
Because of this, I have no interest in trying to buy into this market at the moment, and I would love to see some type of pullback. If we get some type of collapse toward the $26 level, that could be an entry point.
DAX
(Click on image to enlarge)
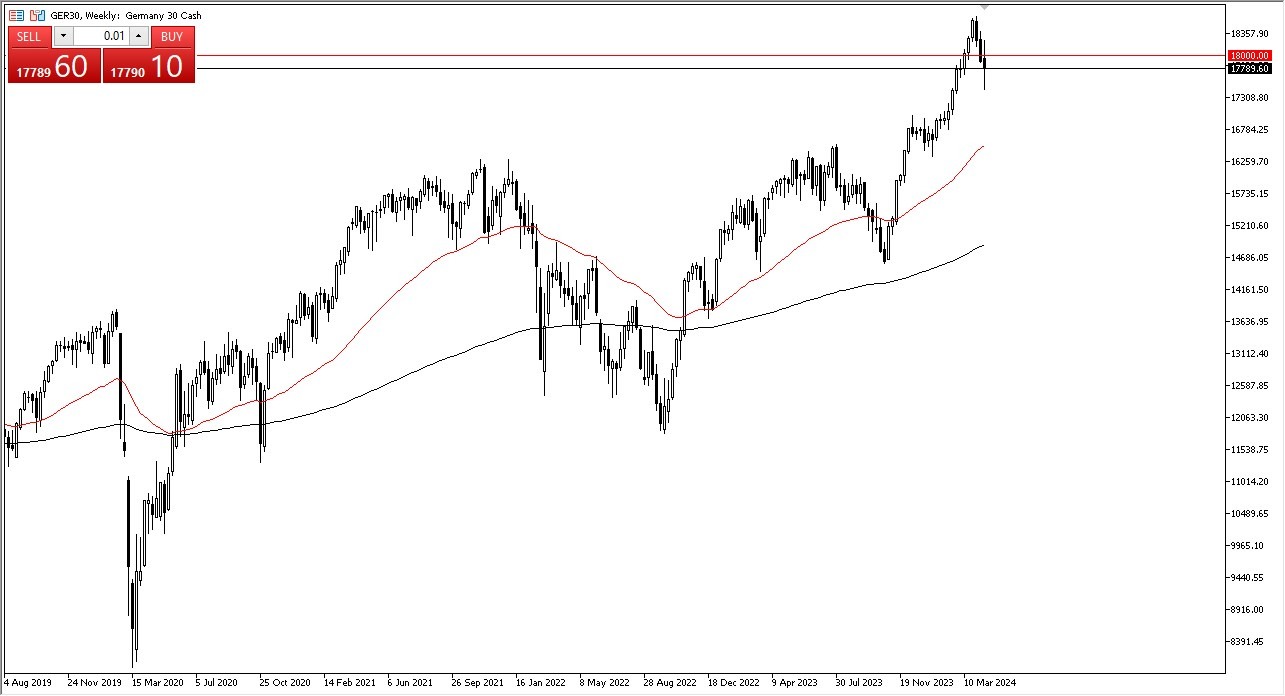
The German DAX moved all over the place during the course of the week, but it looks as if the buyers have been trying to step in and pick up the market a bit. By doing so, I think that a move above the EUR18,000 level would attract a lot of attention, perhaps bringing traders into the fold and allowing for a move back to the recent high.
Short-term pullbacks at this point should continue to see support near the EUR17,500 level, which is an area that has a certain amount of psychology attached to it. As the ECB appears likely to cut rates in the next few months, such a move could benefit German equities.
Gold
(Click on image to enlarge)
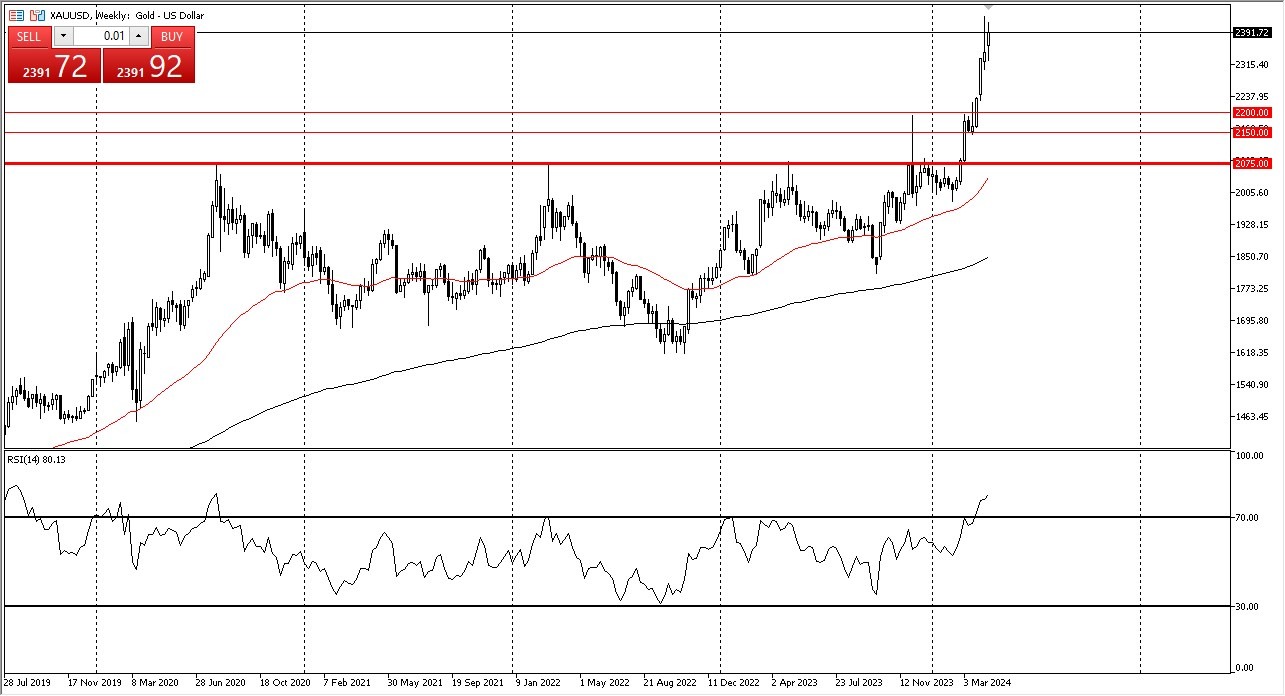
Gold witnessed some positive momentum for the week, as it continued to dance just below the $2400 level. This is a market that is going to continue to be very noisy, and gold certainly appears to be overbought on the Relative Strength Index.
Because of this, a bit of a short-term pullback would probably open up the possibility of buying into a strong market, and I believe that the $2200 level could provide a significant amount of support. At this point, I have no interest in trying to be short of this market.
Nasdaq 100
(Click on image to enlarge)
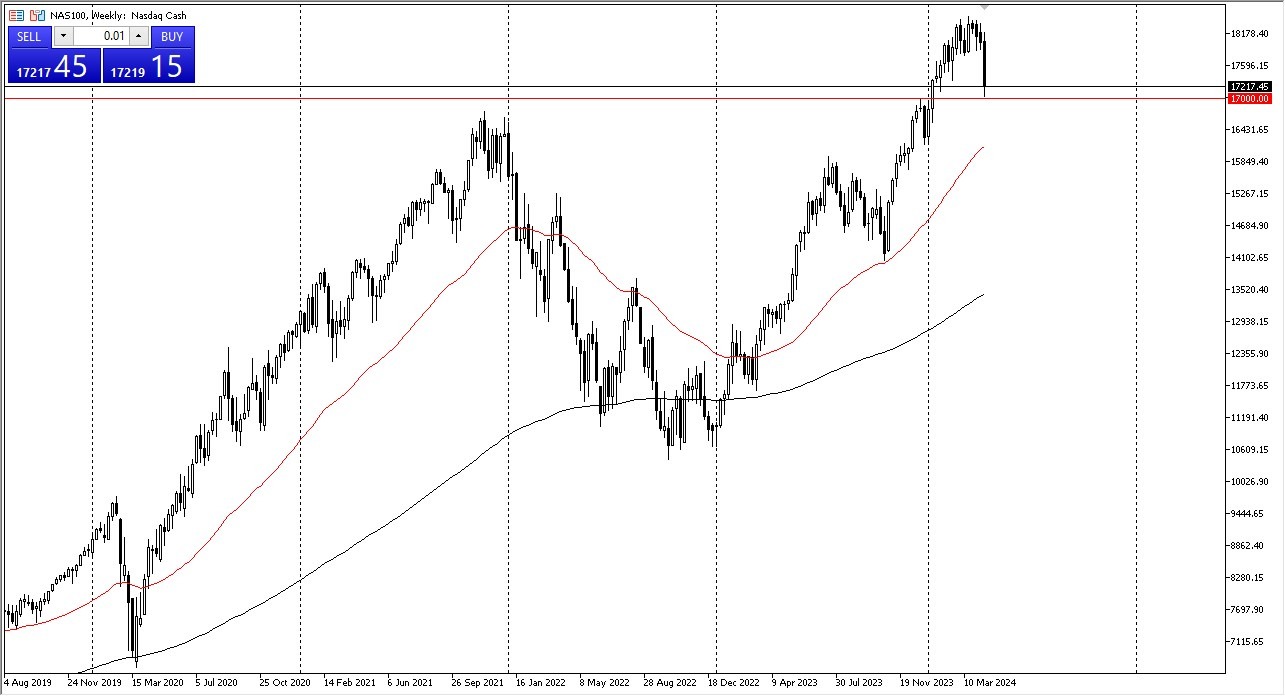
The Nasdaq 100 witnessed a very rough week, as traders continued to worry about the likelihood of interest rates staying higher for longer. With that being said, I think the $17,000 level is an area that a lot of traders will want to watch, as it was the “flash crash low” from the overnight trading between Thursday and Friday during the Israeli attack on Iran.
As long the index can hold the above that point, there is the possibility of a bit of a bounce. However, it’s also worth noting that earnings season will continue to be front and center, as well.
GBP/CHF
(Click on image to enlarge)
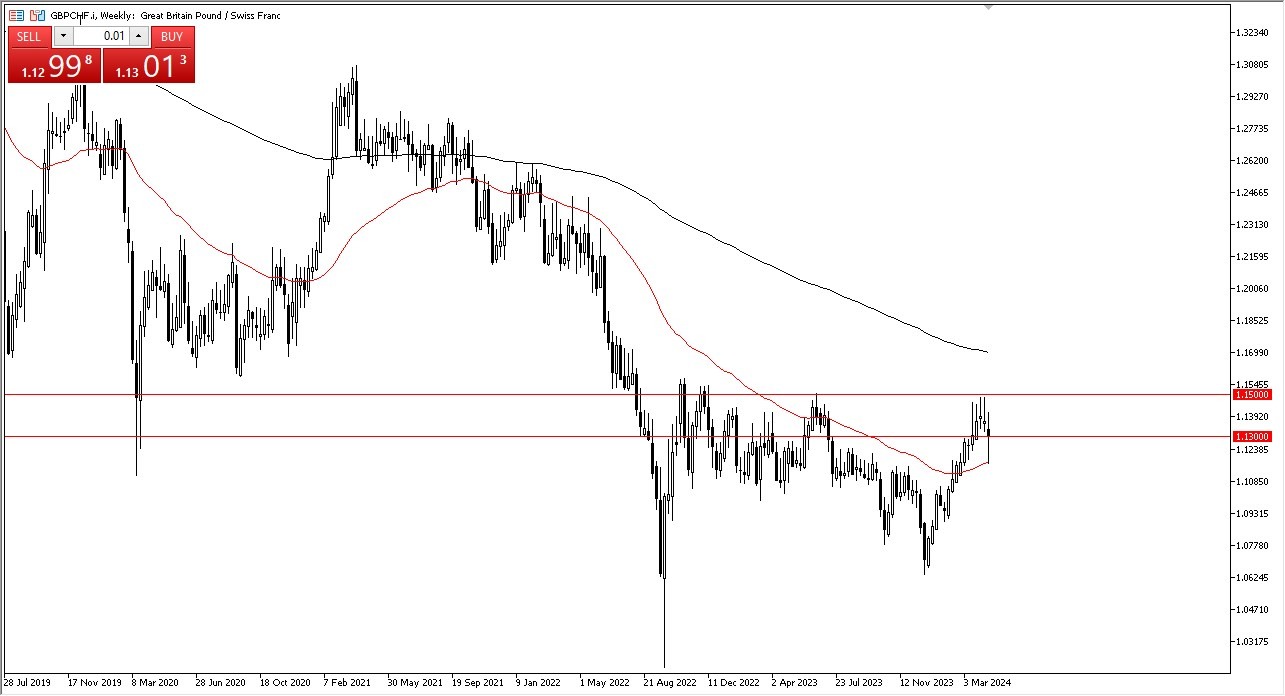
The British pound appeared to be very volatile against the Swiss franc during the trading week, but it bounced quite drastically after the Israeli attack sent the market lower. The 50-week EMA is an area that seems to be offering support, and now the pound seems to be hanging around the 1.13 level. In other words, the pound's resiliency has shown itself, and it may suggest that perhaps it will continue to grind to the upside.
If the pound can break above the 1.15 level, then the market could go much higher. In the meantime, keep in mind that you get paid a positive swap at the end of each trading session, and it’s a positive market.
Bitcoin
(Click on image to enlarge)
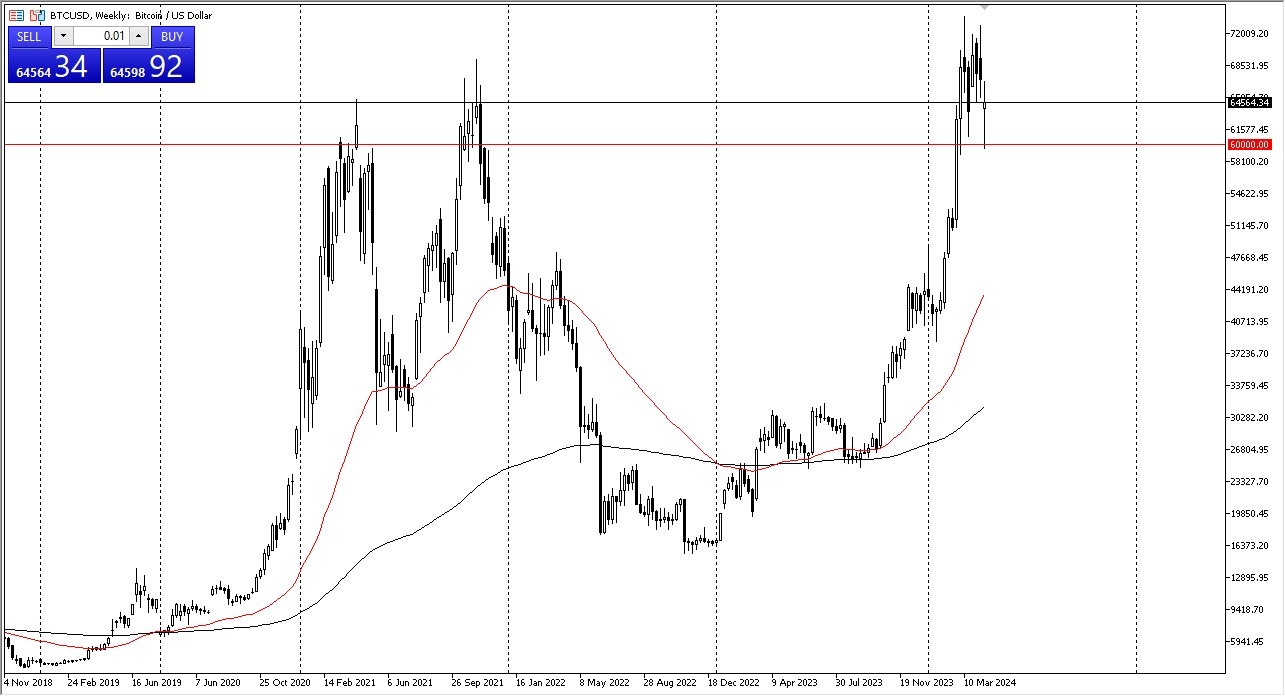
Bitcoin plunged during most of the week, but the cryptocurrency found massive amounts of buying pressure near the $60,000 level, which is an area that I will continue to pay close attention to. It’s a large, round, psychologically significant figure, and an area that previously had meant quite a bit to the market.
The fact that we have seen Bitcoin bounce almost $5000 from that level suggests that buyers are willing to come in and pick this market up as it continues to offer value in what should be a strong uptrend over the longer-term. At this point, I would not be surprised at all to see Bitcoin reach toward the $70,000 level.
GBP/JPY
(Click on image to enlarge)
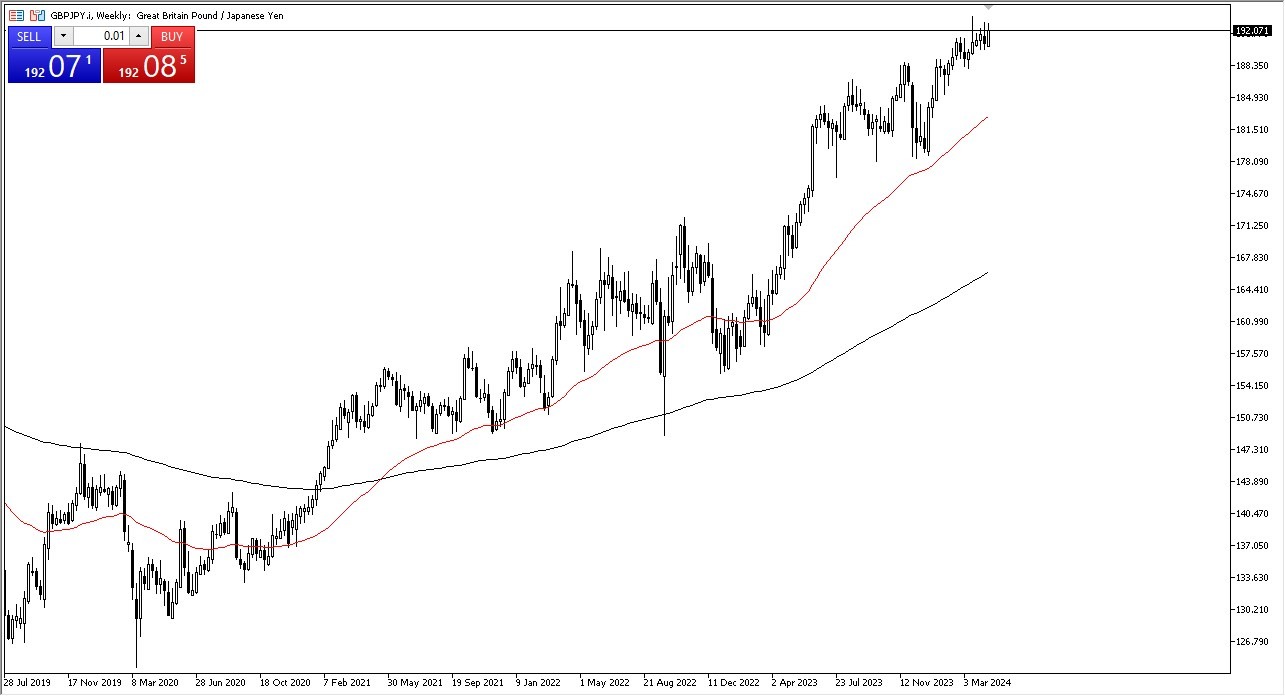
The British pound rallied rather significantly against the Japanese yen during the week, and it seems as if every time we see it pull back, there are plenty of buyers waiting to get involved. In fact, you could say the same thing about almost all yen-denominated currency pairs.
In general, as long as the market continues to see buyers coming in on dips, I don’t see any reason why it won’t go higher. Furthermore, the interest rate differential favors the British pound, so I think we will continue to see a lot of upward pressure over the longer-term.
USD/CAD
(Click on image to enlarge)
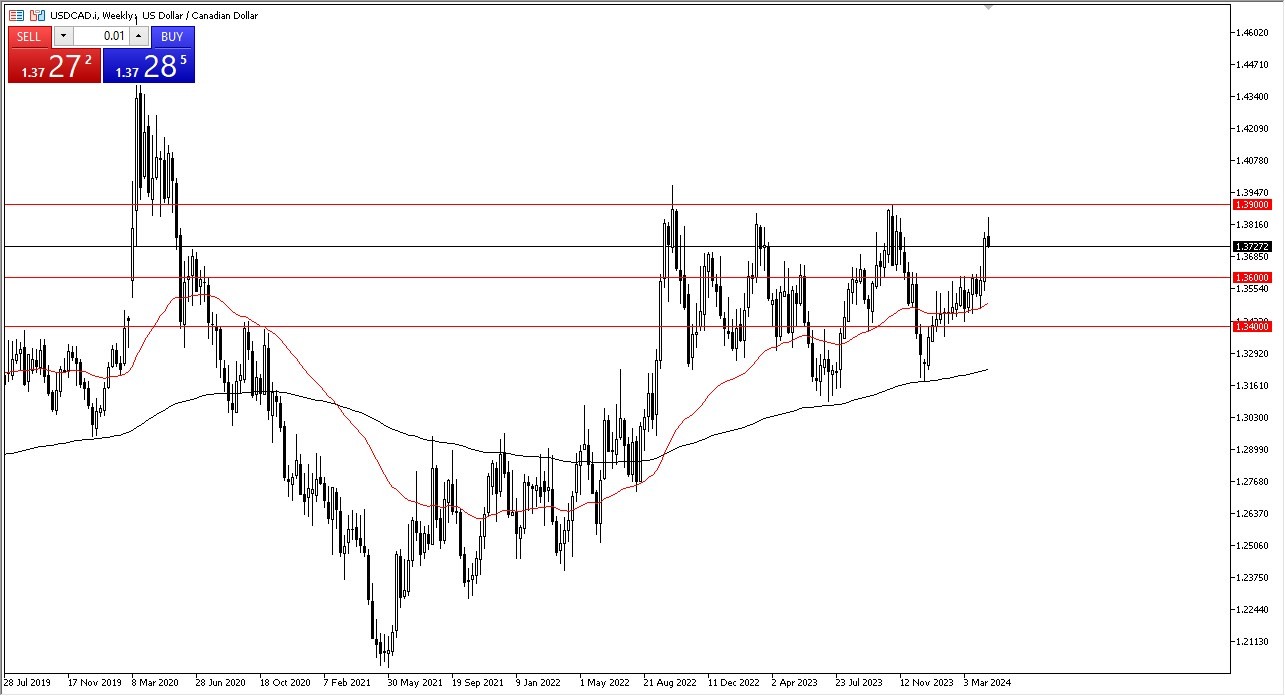
The US dollar initially rallied during the week, but then turned around to show signs of negativity. It did get fairly close to the 1.39 level, which is a large, round, psychologically significant figure. Because of this, I think the dollar got a little ahead of itself, and a short-term pullback is likely in the cards. I believe that the 1.36 level underneath is going to end up being a massive support level.
More By This Author:
BTC/USD Forecast: Bounces From SupportGBP/CHF Forex Signal: Stable Against Franc
GBP/USD Forecast: Range Bound Confusion
Disclaimer: DailyForex will not be held liable for any loss or damage resulting from reliance on the information contained within this website including market news, analysis, trading signals and ...
more
