
Owens-Illinois Remains At Number One On S&P 500 Top-Stock List
We can use our data to track individual stocks, industries, sectors, and indices. For today's bulletin, we present key metrics for the top picks in the S&P 500. The companies listed below represent the top-ten BUY/STRONG BUY stocks within the index. They are presented below according to their one-month forecast target prices.
This week, we saw a 30% turnover for our list since the last time we looked at the SP500 in February. Our newcomers are NRG Energy (NRG), General Motors (GM), and Western Digital (WDC). Those companies replaced Hewlett-Packardnterprise (HPE), Principal Financial Group (PFG), and BorgWarner (BWA).
Owens Illinois (OI), our new leader the last time we ran the SP500 top-ten list, retains its position at number one.
We had four declining stocks this time around. Lincoln National (LNC), Navient Corp. (NAVI), Hewlett Packard (HPQ), and Unum Group (UNM) all fell down a few spots.
Moving up are Discover Financial (DFS) and Morgan Stanley (MS).
Once again, we have a top-ten list that is dominated by Finance Sector firms. All of the names on this list are rated STRONG BUY.
|
Ticker |
Company Name |
Market Price |
Valuation |
Last 12-M Retrn |
1-M Forecast Retn |
1-Yr Forecast Retn |
P/E Ratio |
Sector Name |
Feb. 2, 2017 |
|
OI |
OWENS-ILLINOIS |
20.09 |
-5.79% |
39.81% |
1.34% |
16.13% |
8.57 |
Industrial Products |
OI |
|
NRG |
NRG ENERGY INC |
17.46 |
-19.64% |
31.28% |
1.33% |
16.00% |
7.78 |
Utilities |
LNC |
|
LNC |
LINCOLN NATL-IN |
68.97 |
9.49% |
72.68% |
1.30% |
15.69% |
10.34 |
Finance |
NAVI |
|
DFS |
DISCOVER FIN SV |
70.63 |
7.31% |
45.00% |
1.10% |
13.23% |
12.12 |
Finance |
HPQ |
|
MS |
MORGAN STANLEY |
45.85 |
9.24% |
80.30% |
1.09% |
13.13% |
14.59 |
Finance |
UNM |
|
NAVI |
NAVIENT CORP |
14.66 |
8.13% |
27.04% |
1.09% |
13.07% |
7.95 |
Finance |
DFS |
|
GM |
GENERAL MOTORS |
37.09 |
4.14% |
19.45% |
1.04% |
12.46% |
5.91 |
Auto-Tires-Trucks |
PFG |
|
HPQ |
HP INC |
17.57 |
24.77% |
54.12% |
1.04% |
12.43% |
10.82 |
Computer and Technology |
BWA |
|
WDC |
WESTERN DIGITAL |
76.72 |
16.41% |
68.21% |
1.02% |
12.24% |
13.83 |
Computer and Technology |
MS |
|
UNM |
UNUM GROUP |
48.17 |
21.76% |
52.78% |
1.00% |
12.01% |
12.15 |
Finance |
HPE |
NOTE: New stocks are in BOLD.
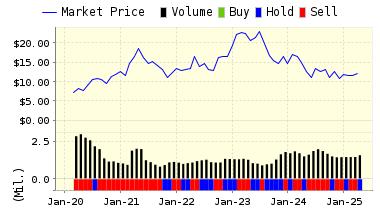
Below is today's data on NRG Energy (NRG):
NRG Energy Inc owns and operates a diverse portfolio of power-generating facilities, primarily in the United States. Its operations include baseload, intermediate, peaking, and cogeneration facilities, thermal energy production and energy resource recovery facilities.
We have seen a lot of energy firms dominating our top stock lists over the past few months as the sector has undergone a strong recovery as crude prices have bounced back and investors have jumped back into the shares. But, often the firms we see are in counter intuitive industries--such as coal.
With NRG Energy, we have smoothening different. The utility company owns Green Mountain Energy, one of the largest "green" energy firms in the US. Green Mountain is a big player in the wind energy business.
However, NRG also makes a lot of energy from the more traditional fossil fuels as well. But, that doesn't change the fact that they can produce more energy from wind than most utilities and they can more fully integrate the renewable sources with their traditional fossil fuel plants. They also derive a benefit from the carbon-reducing output provided by the wind power.
The company posted a nice beat the last time earnings were reported at the end of February--$0.90/share vs estimates for a loss of $0.10 with an increase of 60% over Q4 2015. However, revenues were down 9% for the quarter and 15.8% year-over-year..
ValuEngine continues its STRONG BUY recommendation on NRG Energy for 2017-03-15. Based on the information we have gathered and our resulting research, we feel that NRG Energy has the probability to OUTPERFORM average market performance for the next year. The company exhibits ATTRACTIVE P/E Ratio and Price Sales Ratio.
|
ValuEngine Forecast |
||
|
Target |
Expected |
|
|---|---|---|
|
1-Month |
17.69 | 1.33% |
|
3-Month |
17.52 | 0.35% |
|
6-Month |
17.57 | 0.61% |
|
1-Year |
20.25 | 16.00% |
|
2-Year |
15.88 | -9.07% |
|
3-Year |
14.12 | -19.11% |
|
Valuation & Rankings |
|||
|
Valuation |
19.64% undervalued |
Valuation Rank(?) |
|
|
1-M Forecast Return |
1.33% |
1-M Forecast Return Rank |
|
|
12-M Return |
31.28% |
Momentum Rank(?) |
|
|
Sharpe Ratio |
-0.02 |
Sharpe Ratio Rank(?) |
|
|
5-Y Avg Annual Return |
-0.64% |
5-Y Avg Annual Rtn Rank |
|
|
Volatility |
33.49% |
Volatility Rank(?) |
|
|
Expected EPS Growth |
-59.73% |
EPS Growth Rank(?) |
|
|
Market Cap (billions) |
5.90 |
Size Rank |
|
|
Trailing P/E Ratio |
7.78 |
Trailing P/E Rank(?) |
|
|
Forward P/E Ratio |
19.33 |
Forward P/E Ratio Rank |
|
|
PEG Ratio |
n/a |
PEG Ratio Rank |
|
|
Price/Sales |
0.48 |
Price/Sales Rank(?) |
|
|
Market/Book |
3.38 |
Market/Book Rank(?) |
|
|
Beta |
1.25 |
Beta Rank |
|
|
Alpha |
0.18 |
Alpha Rank |
|


