
On The Street Hypotheses' Burning, As The Slow-Growth Economy Keeps Turning
After largely discounting a slow first-quarter of the year, the strategist and analyst communities were crowing about an expected second-quarter rebound. A stronger-than-expected April PPI reading had some inflation hawks calling for a strong CPI reading. The bond market was having none of it and, in spite of a soft 30-year U.S. government bond auction (which followed soft 10-year and 3-year UST auctions), long-term UST yields declined. There was the expectation that strong PPI data would lead to strong CPI data. However, in a world in which competition for consumers’ dollars are fiercer than I can remember, I questioned whether or not businesses could pass increases on to consumers. I was not alone. That appeared to be the consensus view among bond market participants. April CPI and Retail Sales data justified our cautious outlook.
April Consumer Prices rose 0.2%, on a monthly basis. This was up from a prior -0.3% and in line with the Street consensus estimate. Core CPI (ex-food and energy) rose just 0.1% in April. This was up from a prior -0.1%, but below the Street consensus estimate of 0.2%. On an annual basis, CPI rose 2.2%, down from 2.4%. Core CPI (ex-food and energy) printed at 1.9%, down from a prior 2.0%.
April Retail Sales rose 0.4%, month over month. Although this was lower than the Street consensus estimate of 0.6%, the March figure was revised upward to 0.1% from an initial reading of -0.2%. Core Retail Sales (ex-autos and gasoline) rose 0.3%, this was down from a prior revised 0.4%, but that was an improvement from an initial reading of 0.1%.The so-called Retail Sales Control Group (ex-autos, gasoline and building materials) printed at 0.2%. Although this was lower than the Street consensus estimate of 0.4%, the March reading was revised up to 0.7% from an initial reading of 0.5%.
The data says much about the U.S. economy. For one, the CPI data tell us that businesses may be unwilling or unable to fully pass on higher prices to consumers in a very competitive market place. This could augur for tamer consumer inflation than inflation hawks are predicting. Secondly, the unwillingness or inability of businesses to pass on costs to consumers could begin to squeeze profit margins. I do not see this as problematic, per se, as U.S. corporations currently enjoy healthy profit margins. A little margin squeeze probably doesn’t hurt them much. However, it could result in smaller share price gains and dividend increases, in the not-too-distant future.
Retail Sales data were also very telling. The biggest gainers were healthcare, electronics, building materials and non-store retailers. Other than building materials, the biggest gains in retail sales came in sectors which reflect today’s economy. The rise in healthcare prices can be tied to an aging population. Electronics and non-store retail sales are also reflective of the new digital/neural economy. Where spending is greatest is occurring in disinflationary or deflationary areas of the economy. The two biggest gainers were non-store retail sales (1.4%) and electronics (1.3%). Non-store retailers, such as Amazon, have lowered or held down prices for consumers goods. Moore’s law speaks to the deflationary trend in electronics prices. Anyone who has purchased televisions, computers and hand-held devices, during the past 20 years (which is virtually everyone) can attest to this.
CPI data bears this out. The education/communications services sub-category, which encompasses electronic communications, including cellphones, streaming, etc., plunged 2.4% in April, on an annual basis. This was down from a -2.1% annual print, in March. Where were the biggest gains? They were found in:
- Owner Equivalent Rent (24.5% weighting): +3.4%
- Medical Services: (6.7% weighting) +3.1%
- Transportation Services, which includes vehicle insurance: (6.0% weighting) +3.1%
These are readings from so-called core sectors of the economy. What was inflation like for energy? Energy Commodities prices (3.6% weighting) were up 14.5%.
What is happening is that, other than in inelastic areas of the economy (shelter, healthcare, energy, etc.) there is not much inflation. Electronics and communications are experiencing deflation and consumer goods, such as apparel (thanks in large part to online sales) are experiencing disinflation/low inflation.
As retail sales are measured in dollars spent and not units sold, a focus of consumer spending in areas of the economy experiencing low inflation and deflation/disinflation can make Retail Sales and GDP data appear less robust than they are, at least in terms of dollars spent. Thus, this is a prime case of economic models and datasets which have been built for an industrial economy proving to be less useful in a digital/neural economy. That the strongest inflation pressures are found in areas of the economy which have inelastic demand, it tends to push consumers to become more bargain-conscious in other areas of their lives.
This poses a problem for economists, strategists and portfolio managers who are anticipating 3.0% GDP. If consumers focus purchases in areas of the economy which are experiencing deflation/disinflation due to technological advances, published Retail Sales data could appear lackluster and GDP could continue to disappoint.
This begs the question: How do we fix this problem? This question assumes that there is a problem to be fixed. Why do we wish for 2.0% inflation and 3.0% GDP? It is because that, in an industrial economy, these measures usually correlate with a healthy economy and happy consumer. What if technology and consumer preferences for technology, online shopping, etc. augur for lower reads of inflation, retails sales (in terms of dollars spent) and GDP. Meanwhile, the consumer is happy and relatively healthy, in their minds (which is all that really counts).
I am of the opinion that the economy is currently pretty healthy, but technological advancements and efficiencies are showing up as lower prices, from lower production costs, rather than higher prices from productivity-related wage increases. I could be wrong, but after almost eight years of economic expansion, I think we can put to rest the theory of post-crisis overhang and acknowledge that something has fundamentally changed within the U.S. economy and not necessarily for the worse.
Economists looking for stronger inflation pressures could be disappointed, in the coming months. Energy inflation ran at 14.5% (YoY) in April. If energy prices remain range-bound around current levels, year-over-year inflation comps should narrow.
WTI prices, since January 2016 (Bloomberg):
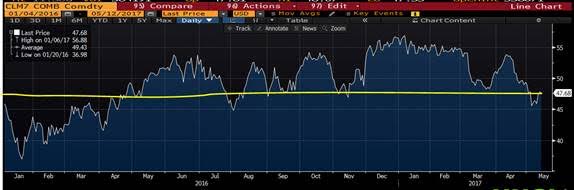
As you can see, since about this time last year, the price of WTI as mainly trended higher than current levels. This means that inflation pressures from energy could evaporate or turn negative, in the coming months. I believe that a 10-year UST note yielding under 2.40% is pricing-in this scenario, in addition to where consumers are spending and their impact on inflation measures.
I was concerned that the okay boost to Retail Sales might cause the Atlanta Fed to lower its Q2 GDPNow estimate. Instead, the GDPNow forecast for Q2 GDP remains at 3.6%. However, it began the week at 4.2%. The good news is that upward revisions to March Retail Sales could result in an upward revision to Q1 GDP to the 1.00% area. If Q2 prints at 3.6% and Q1 is revised to 1.0%, first-half 2017 U.S. GDP would print around 2.3%, close to the norm for the current expansion. I remain concerned that we could see downward revisions to Q2 GDP estimates as the quarter progresses, as the biggest part of the rebound from seasonal effects in Q1 should occur from April through Mid-May. Hopefully the rebound in consumer activity will prove longer-lasting.
I would like to point out that, on a day in which Retail Sales were strong enough to warrant a GDPNow estimate of 3.6%, the 10-year UST note yield fell to 2.32%, intraday. This was due to the milder-than-expected CPI data. I have said it before and I will say it again, the long end of the UST curve prices to inflation pressures/expectations rather than GDP/GDP forecasts.
Disclaimer: The Bond Squad has over two decades of experience uncovering relative values in the fixed income markets. Let us work for you. more


This is quite good. What's your current outlook?