
On The Fence – Weekly Market Outlook
Once again, stocks managed to end the trading week on the fence, pressured lower by bearish momentum, but perking up at a very important support line when push came to shove on Friday. How we begin the new week is uncertain, but in the current market environment even the first move out of the gate isn't necessarily an indication of the trend's true direction.
We'll sort it all it below, right after a brief run-down of last week's and this week's major economic news, the biggest of which was obviously last month's employment data.
Economic Data
Getting straight to the main event, July's employment picture and job-growth picture were just so-so. The unemployment rate remained even at 5.3%, and the economy added 215,000 new jobs (net) versus expectations for 229,000 new positions. It could have been worse, but also could have been better.
Unemployment & Payroll Growth Chart

Source: Thomson Reuters
Broadly speaking, though it's marching forward, the job market isn't doing a great deal to spur economic growth. At least some job-growth, though, is better than job losses. We really need to see net additions of more than 300,000 jobs to spur significant growth, and more than 400,000 to light a major fire.
The only other economic news item of interest from last week was July's ISM data… the manufacturing index and the services index. The former fell from 53.5 to 52.7, while the latter rose from 56.0 to 60.3. Any reading above 50, however, is considered a positive one.
ISM Indices Chart
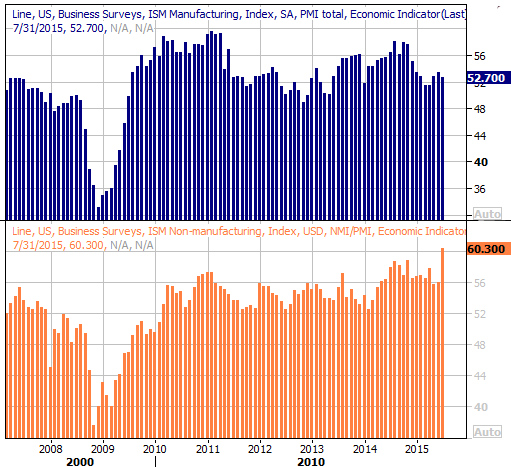
Source: Thomson Reuters
Everything else is on the following grid:
Economic Calendar

Source: Briefing.com
For the coming week, we've got a decent-sized handful of data on the way, though not a great deal of it is hard-hitting stuff. The biggies are Thursday's retail sales, and Friday's industrial productivity data. You may also want to note Friday's producer price inflation figure, if for no other reason than it being a preview of next week's consumer inflation snapshot… one of the key pieces of information Janet Yellen is eyeing when mulling an interest rate hike.
Economists are calling for a 0.5% increase, with or without automobiles. That's a big jump, though it should be noted it's not uncommon to see a nice uptick in retail sales between June and July.
Retail Sales Chart

Source: Thomson Reuters
Stock Market Index Analysis
As has been the case so many times this year, stocks ended last week on the fence… falling, but decidedly supported at a known support level where a bounce (if it's in the cards) would be most likely to materialize.
The daily chart of the S&P 500 (SPX) (SPY) below makes this idea pretty clear. It lost ground on for of last week's five days, including Friday. But, on Friday, all it took was a brush with the lower 20-day Bollinger band to spark at least a minor bullish effort. It's something we've seen several times this year, with most of the major bullish swings first starting with an encounter of this lower band line.
S&P 500 & VIX Daily Chart

Chart created with TradeStation
Similarly, the CBOE Volatility Index (VIX) (VXX) seems to have retreated from its brush with its 50-day moving average line and approach toward its upper Bollinger band line. This is another near-term bullish clue we've seen a few times this year.
On the flip side….
While the market has been reversal prone all year long (bullishly and bearishly), counting on a reversal at the Bollinger bands can be a dangerous game – eventually, a Bollinger band will fail as support or resistance. Once that happens, all bets are off because we're in uncharted territory again.
To that end, though not yet technically bearish, the Percent R (using the BigTrends smoothed method) line is clearly sloped in a downward direction. And, the MACD lines are not only showing us a bearish divergence, but both lines are now below zero, suggesting there have been some bigger-picture (even somewhat imperceptible) bearish undertones for a while now. You'll also see there's been better-than-average bearish volume of late.
The confirmation of bearish momentum is simple enough. It will be confirmed when the Percent R line falls below the 20 level, and stays there even after efforts to break back above 20. By that time, the S&P 500 would have moved below the lower Bollinger band line.
With all of that being said, zooming out to the weekly chart of the S&P 500 once again puts the slow-brewing weakness in perspective. Take a look. This chart shows us a slow, arc-shaped slowdown over the course of the past several weeks that has reached a critical breaking point as of the past month. The 200-day moving average line (green) is under pressure, and though it's prompted bounced in the recent past, the bears aren't backing down this time. And, you can also see though the 26-week moving average line (the middle blue line) has already been breached, though it had been a key support level for the better part of many, many months.
S&P 500 & VIX Weekly Chart

Chart created with TradeStation
It's possible the bigger bearish trend may not mean anything and the near-term, and that the market will indeed push up and off the Bollinger bands that halted the pullback on Friday. Traders should prepare for both possibilities, bearing in mind that even if stocks bounce early this coming week, they're still below key short-term moving average lines and are still on the defensive.
In other words, the pressure is on the bulls more than it is the bears. It would take a move back above the 20-day line at 2102 from the S&P 500 to get bullishly excited about being long again. Even then, though, that's no guarantee. We saw it happen two weeks ago, and that rally effort went nowhere.
Yields & Bonds Cross Key Lines, Oil is Close
Last week we pointed out how the 30-year Treasury yields (and by extension, 30-year Treasuries) (TLT) were approaching critical support and resistance lines, respectively. Though both had to regroup and rekindle those respective efforts, it's worth noting eacht5 managed to clear those barriers on Friday.
30 Year Treasury Index & Yield Chart

Chart created with TradeStation
Now that we're back un uncharted territory, it's much easier for these trends to continue on in their current direction.
Separately, it's worth noting crude oil futures (USO) are also on the verge of breaking below a key support level at $44.00 per barrel.
Crude Oil Futures Chart

Chart created with TradeStation
This is the third test of the floor since January, which may end up being one time too many. Should oil break below the floor, there's no immediate context for support anywhere on the radar. The next logical support is 2009's lows around $37 per barrel, which was unthinkable just a few months ago.
Trade Well,
Price Headley
Disclosure: None.


