
Oil Stocks Are On The Move
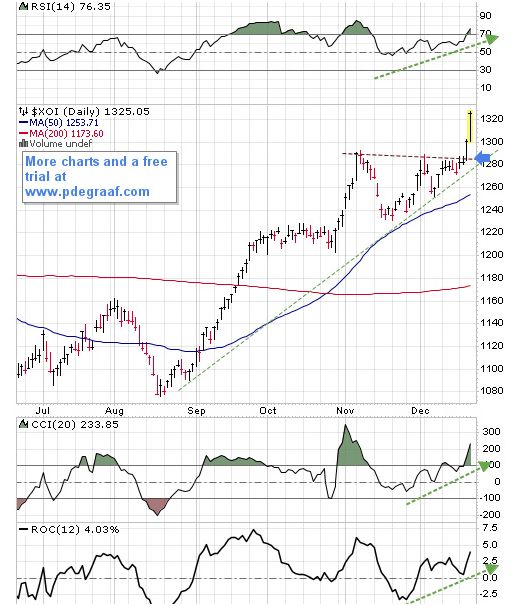
Price is confirming the breakout at the blue arrow. The first target is 1385.
As long as price remains above the rising green support line – the trend is up. The three supporting indicators are positive.The moving averages are positive and rising.
Featured is XOI the oil producers index (courtesy Stockcharts.com).
Disclaimer: Investing involves risk taking. Please do your own due diligence. Peter Degraaf is NOT responsible for your trading decisions.
Peter Degraaf is a stocks and commodities investor ...
more
How did you like this article? Let us know so we can better customize your reading experience.


About time, oil companies go up and catch up with the price of oil itself.
Thanks @[Peter DeGraaf](user:4661). I'm new to this kind of charting but interested to learn more. Could you please expound upon the significance of this? Thank you. $XOI
Good #oil chart. $XOI.