

Photo by Thomas Coker on Unsplash
- The NZD/USD is getting some much-needed lift heading into the Tuesday market session.
- Thin New Zealand showing on the economic calendar to leave the Kiwi exposed to USD flows.
- Later Tuesday sees another round of US PMI data for October.
The NZD/USD is catching some bids into 0.5850 as broad market risk appetite stabilizes heading into a bumper week of US data readings.
The economic calendar is notably absent any meaningful Kiwi-based figures for NZD traders to chew on, leaving the NZD/USD to get pushed around by market reactions to US growth and inflation figures.
Tuesday sees US Purchasing Manager Index (PCI) figures for October, and both components of the PMI are forecast to decline, albeit slightly: the Manufacturing PMI is expected to tick down from 49.8 to 49.5, while the Services PMI is seen declining from 50.1 to 49.9, slipping back into expected contraction territory to match manufacturing expectations.
Wednesday follows up with a speech from Federal Reserve (Fed) Chairman Jerome Powell, followed by US Gross Domestic Product (GDP) figures on Thursday; US GDP is expected to accelerate in the third quarter, from 2.1% to 4.2% for the annualized period into 3Q.
Friday will close out the trading week with another inflation headline for the US: Personal Consumption Expenditure (PCE) Index data for September is expected to increase from 0.1% to 0.3%.
Accelerations in underlying inflation figures for the US bode poorly for broad market sentiment as investors are hoping for a walk back on interest rate expectations from the Fed, but sticky inflation will prove a difficult hurdle for the US central bank to overcome before they can start bringing rates down. The Fed's current "dot plot" doesn't see any rate cuts until the latter half of 2024 as it currently stands.
NZD/USD Technical Outlook
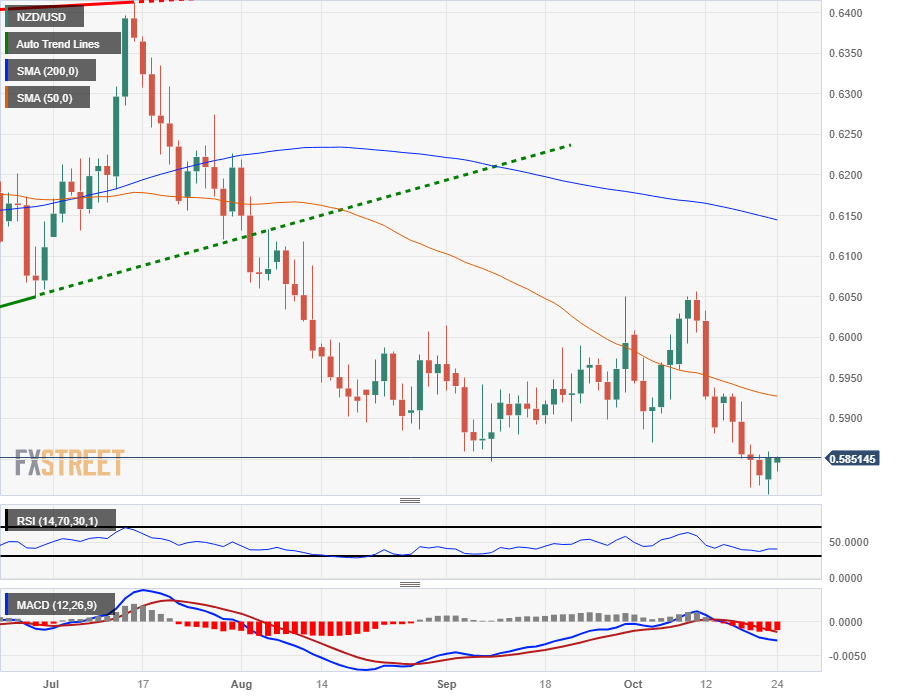
The Kiwi remains trapped under long-term bearish momentum despite Monday's relief rally, and the pair continues to waffle near twelve-month lows.
Technical support is limited just north of the 0.5800 handle, while the 50-day Simple Moving Average (SMA) is punishing down on price action from 0.5927.
A bullish recovery will need to overcome the 0.6000 major psychological handle, with the near-term ceiling sitting at the last swing high into 0.6056, while a downside break will see the NZD/USD set for a run at old support levels originally chalked in from late 2022 near the 0.5600 level.
NZD/USD Daily Chart
(Click on image to enlarge)
NZD/USD Technical Levels
NZD/USD
| OVERVIEW | |
|---|---|
| Today last price | 0.5849 |
| Today Daily Change | 0.0019 |
| Today Daily Change % | 0.33 |
| Today daily open | 0.583 |
| TRENDS | |
|---|---|
| Daily SMA20 | 0.5939 |
| Daily SMA50 | 0.5932 |
| Daily SMA100 | 0.6048 |
| Daily SMA200 | 0.6149 |
| LEVELS | |
|---|---|
| Previous Daily High | 0.5856 |
| Previous Daily Low | 0.5817 |
| Previous Weekly High | 0.5931 |
| Previous Weekly Low | 0.5815 |
| Previous Monthly High | 0.605 |
| Previous Monthly Low | 0.5847 |
| Daily Fibonacci 38.2% | 0.5832 |
| Daily Fibonacci 61.8% | 0.5841 |
| Daily Pivot Point S1 | 0.5813 |
| Daily Pivot Point S2 | 0.5795 |
| Daily Pivot Point S3 | 0.5774 |
| Daily Pivot Point R1 | 0.5852 |
| Daily Pivot Point R2 | 0.5873 |
| Daily Pivot Point R3 | 0.589 |
More By This Author:
Canadian Dollar Looking For Early Gains Against US Dollar Ahead Of Upcoming BoC Rate CallSilver Price Forecast: XAG/USD Drops To Near $23 As 10-Year US Yields Soar To 5%
US Dollar Faces Pressure As Israel Ground Offensive Gets Delayed


Comments
Log in or sign up to join the conversation.