
The NZD/USD pair trades in a limited range between 0.6105-0.1030 in Monday’s early American session. The Kiwi asset consolidates as uncertainty over when the Federal Reserve (Fed) will start reducing interest rates has deepened. Investors see the Fed to begin reducing rates from the September and a subsequent move in the November or December meeting.
Contrary to market expectations, Fed policymakers see only one rate cut this year in the last quarter. Officials want to see inflation declining for months to gain conviction before pivoting to policy-normalization.
The US Dollar Index (DXY) has dropped to 105.50 amid a cheerful market mood. On Friday, the US Dollar witnessed strong buying interest as the preliminary S&P Global PMI report showed that overall activity surprisingly expanded, with robust improvement in the manufacturing and service sectors.
This week, investors will focus on the United States (US) core Personal Consumption Expenditure price index (PCE) for May, which will provide fresh cues on when and how much the central bank will reduce interest rates this year.
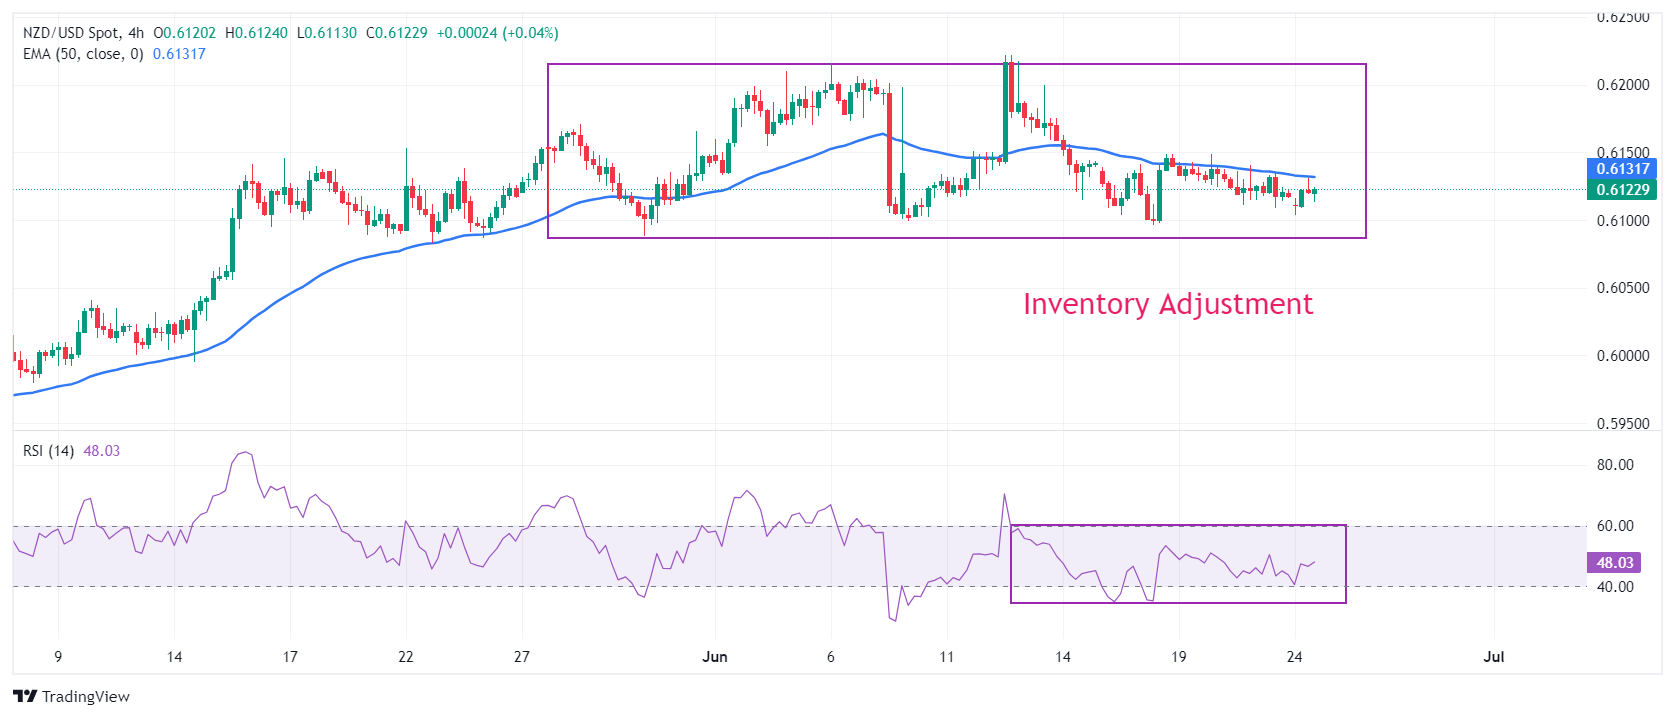
NZD/USD exhibits an inventory adjustment formation on a four-hour timeframe, which indicates an auction in a limited range with lower volume. Generally, the inventory adjustment process results in a decisive break in either direction. The Kiwi asset trades below the 50-period Exponential Moving Average (EMA) near 0.6133, suggesting a sharp volatility contraction.
The 14-period Relative Strength Index (RSI) oscillates in the 40.00-60.00 range, indicating indecisiveness among investors.
Fresh downside would appear if the asset delivers a decisive break below the round-level support of 0.6100. This would drag the asset towards April 4 high around 0.6050 and psychological support of 0.6000.
On the contrary, a reversal move above June 12 high of 0.6222, which will expose the asset January 15 high near 0.6250, followed by January 12 high near 0.6280.
NZD/USD four-hour chart
NZD/USD
| OVERVIEW | |
|---|---|
| Today last price | 0.6125 |
| Today Daily Change | 0.0007 |
| Today Daily Change % | 0.11 |
| Today daily open | 0.6118 |
| TRENDS | |
|---|---|
| Daily SMA20 | 0.6148 |
| Daily SMA50 | 0.6058 |
| Daily SMA100 | 0.607 |
| Daily SMA200 | 0.6066 |
| LEVELS | |
|---|---|
| Previous Daily High | 0.614 |
| Previous Daily Low | 0.6109 |
| Previous Weekly High | 0.6149 |
| Previous Weekly Low | 0.6096 |
| Previous Monthly High | 0.6171 |
| Previous Monthly Low | 0.5875 |
| Daily Fibonacci 38.2% | 0.6121 |
| Daily Fibonacci 61.8% | 0.6128 |
| Daily Pivot Point S1 | 0.6104 |
| Daily Pivot Point S2 | 0.6091 |
| Daily Pivot Point S3 | 0.6073 |
| Daily Pivot Point R1 | 0.6136 |
| Daily Pivot Point R2 | 0.6154 |
| Daily Pivot Point R3 | 0.6167 |
More By This Author:
USD/CAD Price Analysis: Extends Its Upside On Unexpectedly Robust Preliminary US PMI GrowthEUR/USD Slumps Due To Weak Eurozone PMIs, Firm US Dollar
Silver Price Forecast: XAG/USD Stays Firm Above $29 Amid Firm Fed Rate-Cut Hopes


Comments
Log in or sign up to join the conversation.