
On Friday, the NZD/USD extended its losing streak to three days. Despite an attempt to rally which took the pair to a high of 0.6140, the bulls were unable to return to the positive side and the pair stabilized at 0.6115 The unsuccessful attempt to maintain gains solidifies the increasing bearish sentiment for the Kiwi. The currency pair must climb past the 20-day Simple Moving Average (SMA) situated at 0.6150 to brighten the otherwise negative outlook.
The Relative Strength Index (RSI) for the NZD/USD pair on the daily chart locates at 49, hinting at a shift of momentum towards more bearishness. Despite this downward shift, the RSI remains near the neutral zone. Furthermore, the Moving Average Convergence Divergence (MACD) continues to increase its red bars, indicating an amplified seller presence in the market.
NZD/USD daily chart
(Click on image to enlarge)
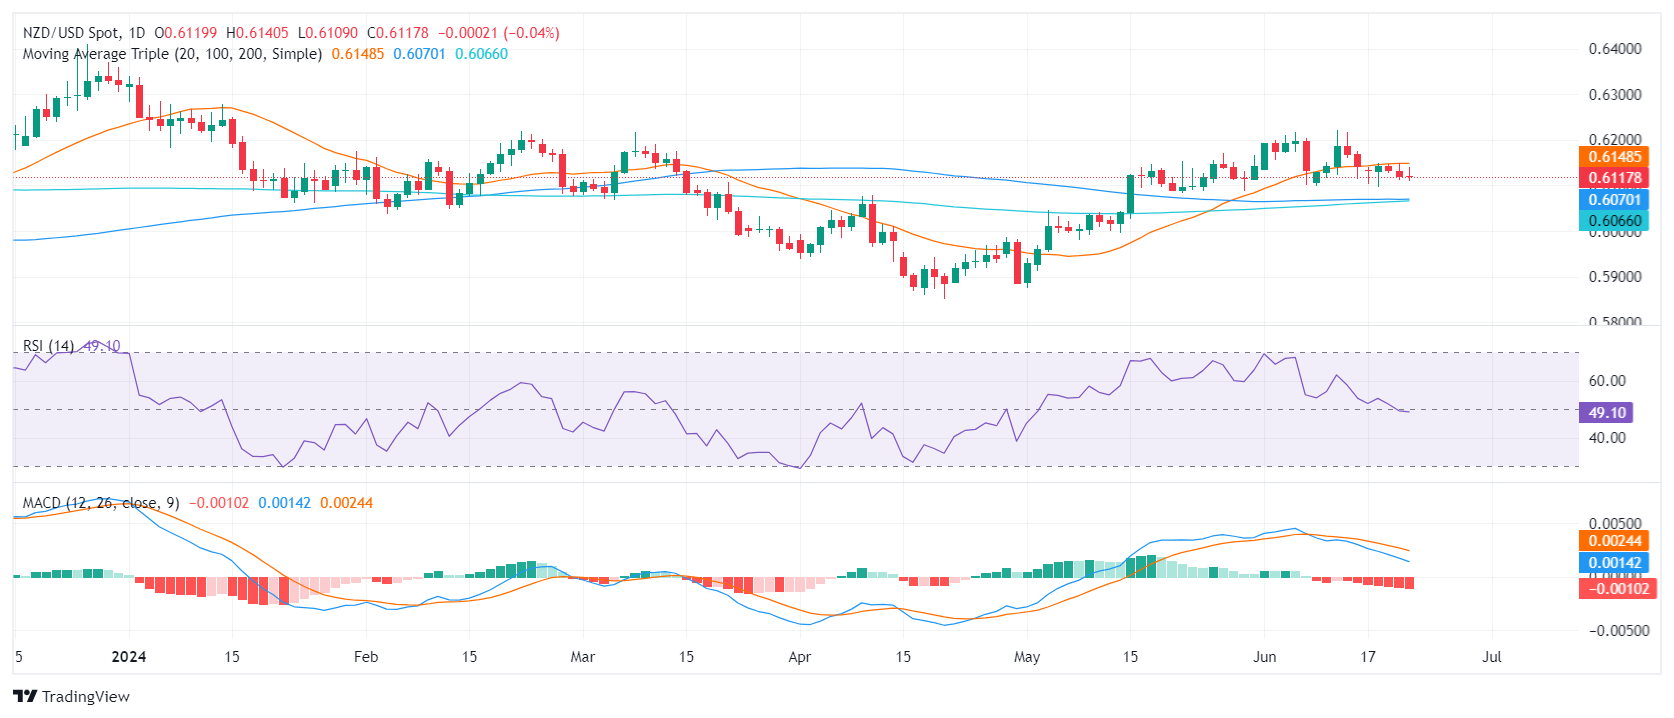
The NZD/USD finds immediate support near the 0.6100 level. Beneath that, additional support resides at the 100-day SMA at 0.6070 and the 200-day SMA at 0.6060. These levels could offer a robust defense should the pair extend its downside. A breach below these SMA convergence points might signal an intensifying sell-off scenario.
Conversely, the first resistance remains around the 20-day SMA level at 0.6150. Higher resistances are found at the 0.6170 and 0.6200 levels. A decisive breakout above these levels could possibly indicate an end to the current bearish market sentiment and start to favor the bulls.
NZD/USD
| OVERVIEW | |
|---|---|
| Today last price | 0.6118 |
| Today Daily Change | -0.0002 |
| Today Daily Change % | -0.03 |
| Today daily open | 0.612 |
| TRENDS | |
|---|---|
| Daily SMA20 | 0.6148 |
| Daily SMA50 | 0.6055 |
| Daily SMA100 | 0.607 |
| Daily SMA200 | 0.6065 |
| LEVELS | |
|---|---|
| Previous Daily High | 0.6149 |
| Previous Daily Low | 0.6111 |
| Previous Weekly High | 0.6222 |
| Previous Weekly Low | 0.6099 |
| Previous Monthly High | 0.6171 |
| Previous Monthly Low | 0.5875 |
| Daily Fibonacci 38.2% | 0.6126 |
| Daily Fibonacci 61.8% | 0.6134 |
| Daily Pivot Point S1 | 0.6104 |
| Daily Pivot Point S2 | 0.6089 |
| Daily Pivot Point S3 | 0.6066 |
| Daily Pivot Point R1 | 0.6142 |
| Daily Pivot Point R2 | 0.6165 |
| Daily Pivot Point R3 | 0.618 |
More By This Author:
GBP/USD Ends The Week Lower As Bearish Turnaround SteepensAustralian Dollar Closes The Week With Losses On Weak PMIs
GBP/USD Price Analysis: Holds Steady Above Mid-1.2600s, Not Out Of The Woods Yet


Comments
Log in or sign up to join the conversation.