
GBP/USD closed Friday at a fresh five-week low of 1.2622, marking the Cable's third straight down week. The Bank of England’s (BoE) midweek rate hold did little to spark confidence in the GBP, and a late-week upswing in US Purchasing Managers Index (PMI) kicked broad-market risk appetite lower, lifting the US Dollar heading into the trading week’s close.
UK Retail Sales lurched higher to 2.9% MoM in May, snubbing the forecast move down to 1.5% from the previous month’s revised -1.8% contraction. UK PMIs also came in mixed, with the S&P Global/CIPS Manufacturing PMI for June rising to 51.4 against the forecast 51.3 and the previous month’s 51.2. The Services PMI contracted sharply to a seven–month low of 51.2, entirely missing the forecast uptick to 53.0 from 52.9.
On the US side, the S&P Global Manufacturing PMI for June rose to 51.7 versus the forecast downtick to 51.0 from the previous 51.3. The Services PMI also thumped expectations, rising to almost a two-year high of 55.1 versus the expected softening to 53.7 from 54.8.
With upbeat US economic data crimping odds of an early rate cut from the Federal Reserve (Fed), market sentiment backed up into the safe haven Greenback on Friday.
UK economic remains thin heading into next week, leaving Sterling traders to wait for next Friday’s Gross Domestic Product (GDP) print. US economic data prints are also relegated to mid-tier releases early next week, with the US’ own GDP update slated for next Thursday.
GBP/USD technical outlook
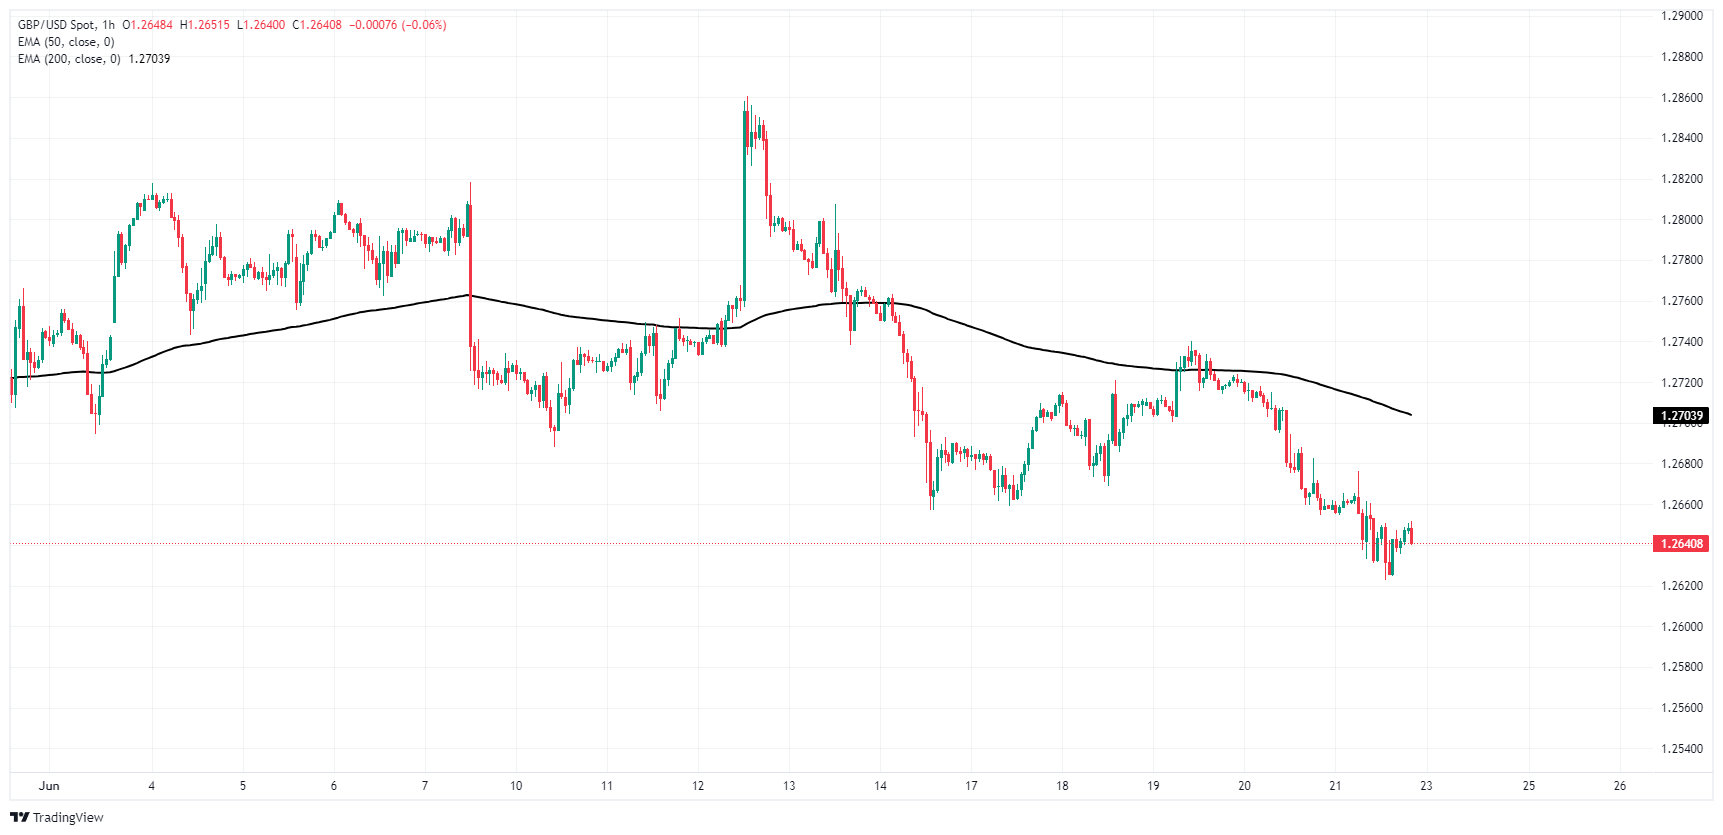
GBP/USD has locked in a third straight down week as the Sterling extends a slump against the Greenback. The pair fell to a five-week low, setting a fresh low for the week early Friday at 1.2622. Cable tumbled -0.92% peak-to-trough from the week’s peak bids near 1.2740.
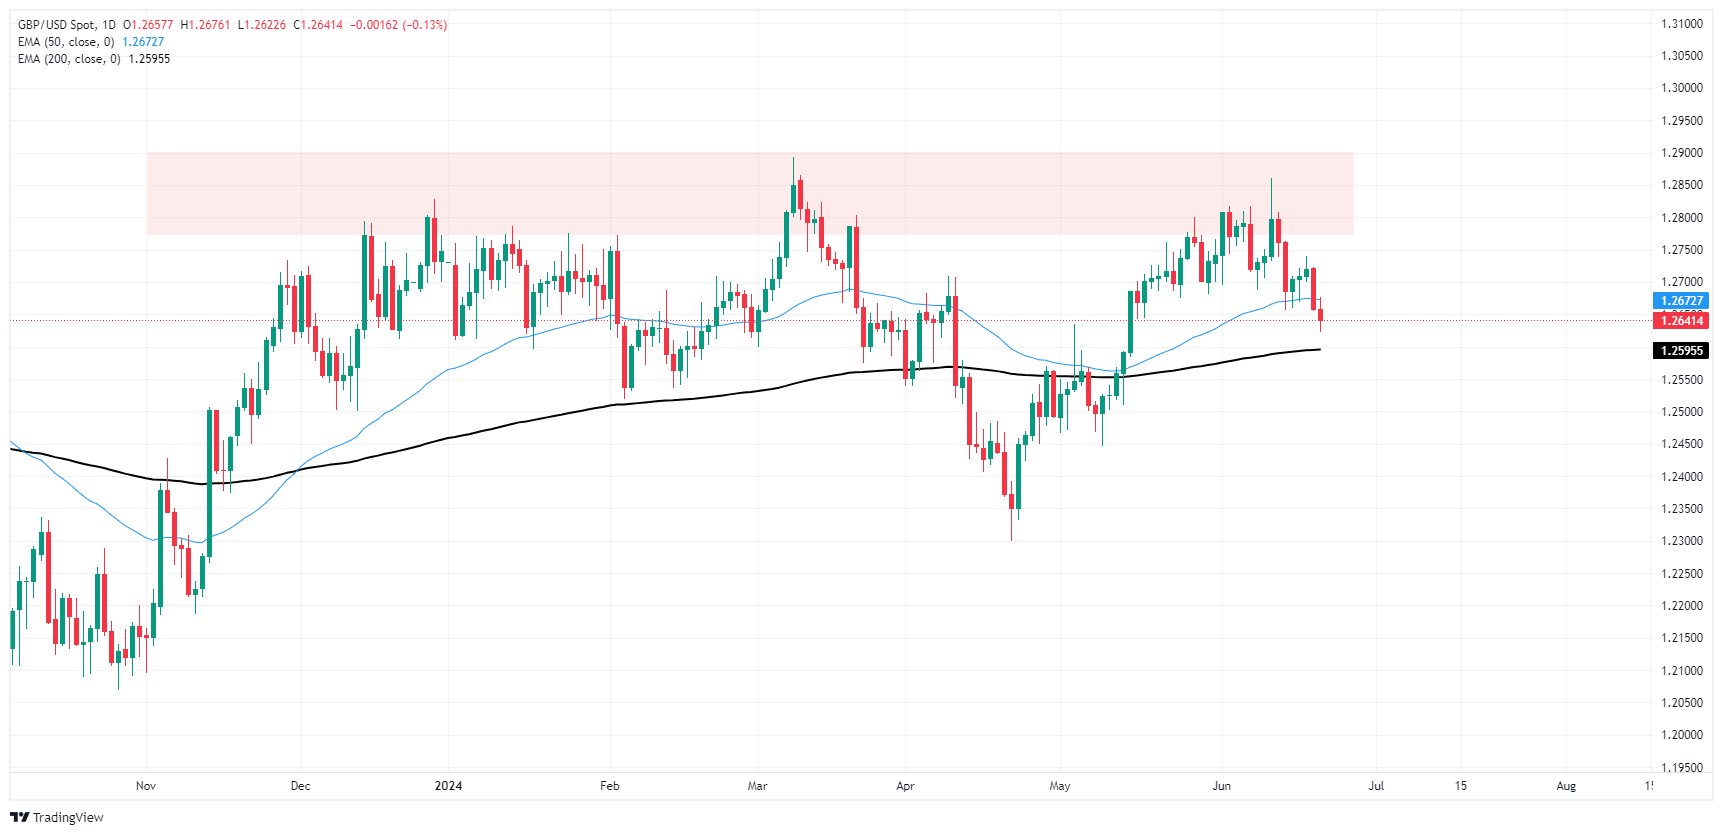
Daily candlesticks are facing a steepening bearish decline after a rejection from a supply zone near the 1.2800 handle. Candles are on pace to fall back to the 200-day Exponential Moving Average (EMA) at 1.2586.
GBP/USD hourly chart
(Click on image to enlarge)
GBP/USD daily chart
(Click on image to enlarge)
GBP/USD
| OVERVIEW | |
|---|---|
| Today last price | 1.2644 |
| Today Daily Change | -0.0014 |
| Today Daily Change % | -0.11 |
| Today daily open | 1.2658 |
| TRENDS | |
|---|---|
| Daily SMA20 | 1.2741 |
| Daily SMA50 | 1.262 |
| Daily SMA100 | 1.264 |
| Daily SMA200 | 1.2555 |
| LEVELS | |
|---|---|
| Previous Daily High | 1.2724 |
| Previous Daily Low | 1.2655 |
| Previous Weekly High | 1.286 |
| Previous Weekly Low | 1.2657 |
| Previous Monthly High | 1.2801 |
| Previous Monthly Low | 1.2446 |
| Daily Fibonacci 38.2% | 1.2681 |
| Daily Fibonacci 61.8% | 1.2698 |
| Daily Pivot Point S1 | 1.2634 |
| Daily Pivot Point S2 | 1.261 |
| Daily Pivot Point S3 | 1.2565 |
| Daily Pivot Point R1 | 1.2703 |
| Daily Pivot Point R2 | 1.2748 |
| Daily Pivot Point R3 | 1.2772 |
More By This Author:
Australian Dollar Closes The Week With Losses On Weak PMIsGBP/USD Price Analysis: Holds Steady Above Mid-1.2600s, Not Out Of The Woods Yet
Gold Price Remains Confined In A Range Around $2,360, Bullish Potential Seems Intact


Comments
Log in or sign up to join the conversation.