NIFTY Elliott Wave Sequence Suggests Further Downside
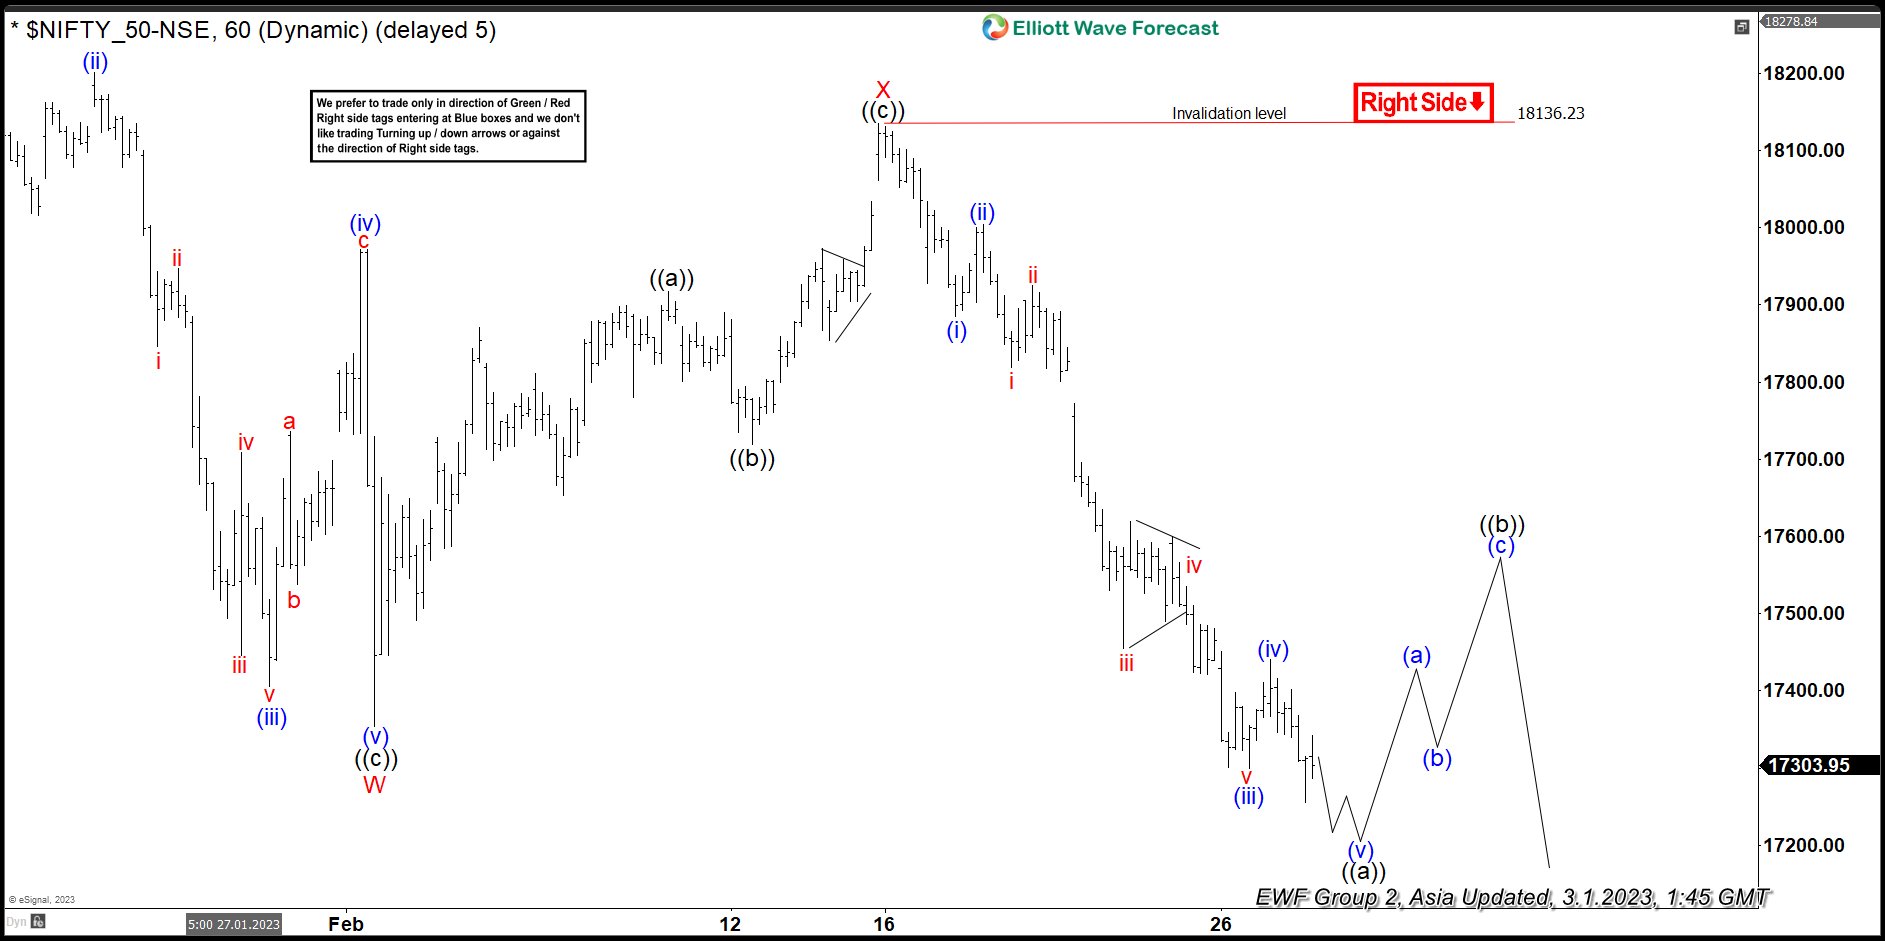
Nifty shows an incomplete bearish sequence from 12.1.2022 high favoring further downside. The decline from 12.1.2022 high is unfolding as a double three Elliott Wave structure. Down from 12.1.2022 high, wave ((a)) ended at 17774.25 and rally in wave ((b)) ended at 18265.25. The Index extends lower again in wave ((c)) towards 17353.4 and this ended wave W in higher degree. Rally in wave X ended at 18136.23 and the Index extends lower again in wave Y.
Down from wave X, wave (i) ended at 17884.6 and wave (ii) ended at 18004.35. Index extends lower again in wave (iii) towards 17299 and rally in wave (iv) ended at 17440.45. Final leg lower wave (v) is in progress and should complete soon. This will end wave ((a)) of Y in higher degree. Afterwards, the Index should rally in wave ((b)) to correct cycle from 2.16.2023 high before the decline resumes. Near term, as far as pivot at 18136.23 high stays intact, expect rally to fail in 3, 7, or 11 swing for further downside. Potential target lower is 100% – 161.8% Fibonacci extension from 12.1.2022 high which comes at 15672 – 16609.
Nifty 60 Minutes Hour Elliott Wave Chart
More By This Author:
AUDUSD: Sell Trade Hits TargetsAdvanced Micro Devices Perfect Reaction Higher from Blue Box Area
Coke (KO) Long Term Structures And Key Levels
Disclaimer: Futures, options, stocks, ETFs and over the counter foreign exchange products may involve substantial risk and may not be suitable for all investors. Leverage can work against you as ...
more


