

Image Source: Unsplash
The Nasdaq 100 (QQQ) is still hanging tough despite some recent volatility. That rising trend line that’s been in place since May is continuing to hold up, and so far, buyers have stepped in every time it’s been tested.
(Click on image to enlarge)
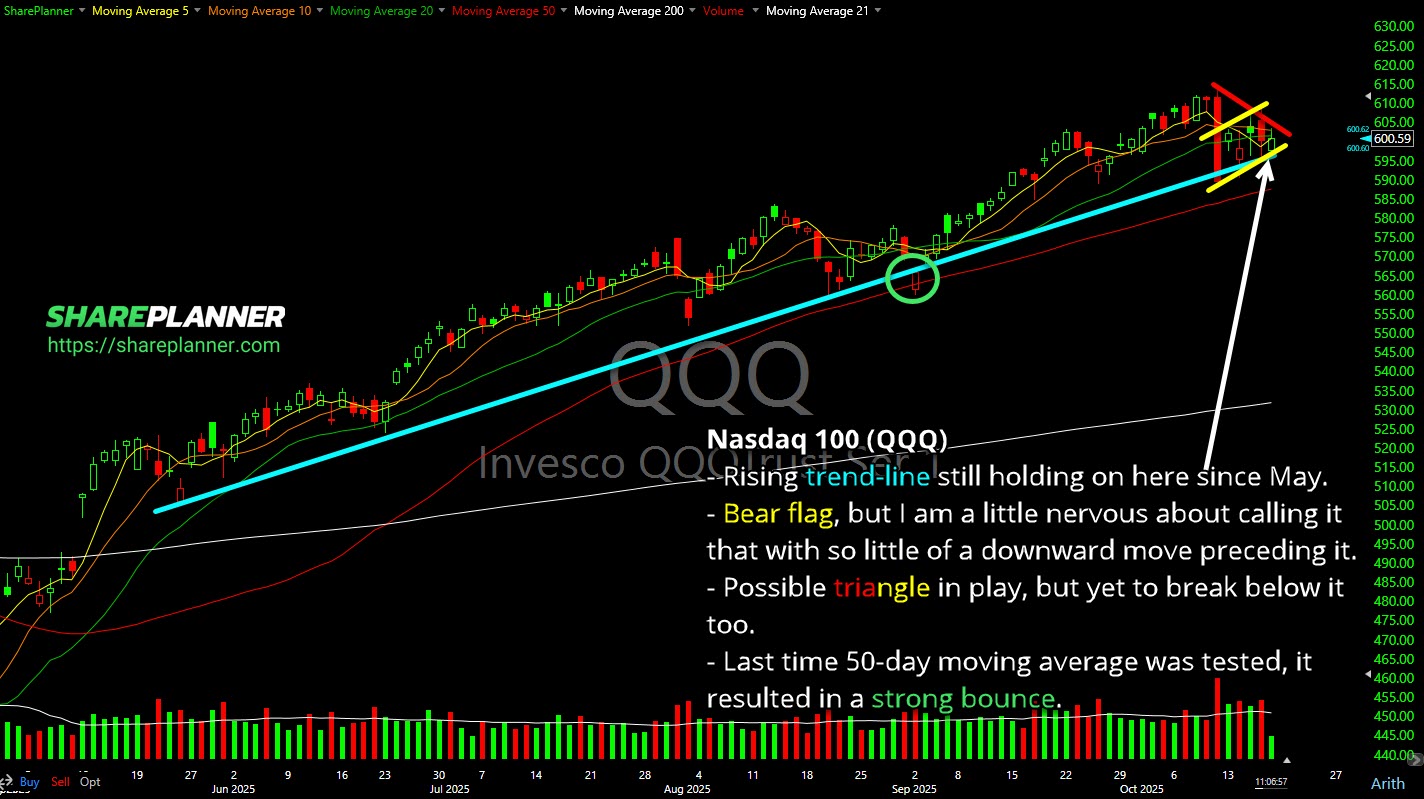
Now, there’s a bit of a debate here on what this current pattern really is. It could be a bear flag, but honestly, I’m a little hesitant to call it that. The move leading into it just hasn’t had much of a downward pull, so it’s hard to give it that label with confidence.
Another way to look at it is a possible triangle pattern forming. Price action is coiling a bit, but we haven’t seen a clean break below the lower boundary yet. That means it’s still a waiting game for confirmation on either side.
But what’s worth noting is the 50-day moving average. The last time QQQ tested that level, it produced a pretty strong bounce. If we see that happen again, it could keep this uptrend intact for a while longer. But if it fails, that would be the first real sign of weakness we’ve seen in months.
What I’m Watching Next
I’ll be keeping a close eye on how QQQ reacts around that 600 level and the 50-day moving average. A bounce here could set up another leg higher toward the recent highs near 620. But if price starts closing below that trend line and the 50-day, things could get a bit messy.
Volume will tell a big part of the story. If we start to see heavier selling with intraday bounce attempts failing as well, that’s a red flag. On the flip side, if volume subsides and we start to bounce, it would likely confirm that bulls are still in control.
Stay disciplined, keep an eye on your levels, and don’t let the noise shake you out of your plan.
More By This Author:
QQQ Looking To Test Major SupportRegional Banks Looking Really Bad
WMT Breakout


Comments
Log in or sign up to join the conversation.