Nasdaq 100 Tech Sector Index At Key Inflection Point
In my prior post, I pointed out the enormous rise in the Nasdaq 100 modified market cap weighted and equal-weighted indices from late 2008. They include the same stocks of the 100 largest non-financial companies based on market capitalization that are listed on the Nasdaq Stock Exchange.
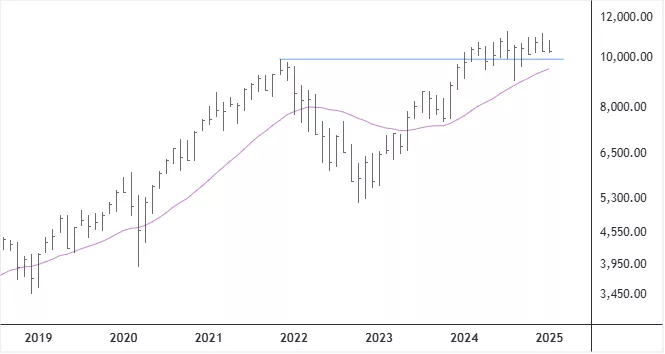
Technology company stocks have by far the largest weight, or more than 50%, in the Nasdaq 100 Index. The Nasdaq-100 Technology Sector Index, an equal-weighted sub-index of the Nasdaq 100, can be used to track the performance of those tech stocks. In recent months, the Index has been consolidating above its November 2021 swing high with the rising purple moving average line approaching current levels.
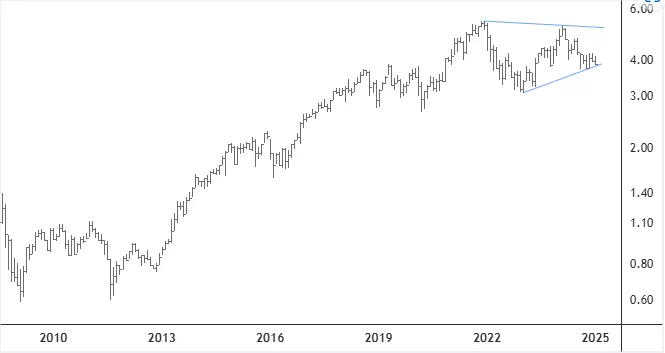
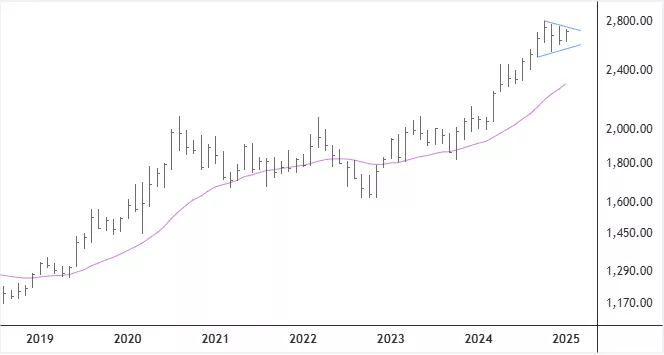
As with the two Nasdaq 100 indices, the Tech Sub-Index has overall outperformed the spot price of gold since 2011. However, if the ratio between the Index and Gold´s Spot Price in U.S. dollars falls convincingly below the blue upsloping line, then the Index might decline sharply and possibly trigger a rise in the price of gold beyond $2,800/oz. Gold´s price has formed a three-bar triangle pattern, suggesting a breakout in either direction is imminent.
Monthly Chart - Nasdaq 100 Technology Sector Index

Monthly Chart - Nasdaq 100 Technology Sector Index vs. Spot Price of Gold

Monthly Chart - Spot Price of Gold

More By This Author:
Nasdaq 100 Indices Vs. Gold Price At Critical Point
Iceland´s Equity Indexes At And Above Their 52-Week Highs
Stock Market Indices In Iceland At Key Inflection Points
Disclosure: The author of the analysis presented does not own shares or have a position or other direct or indirect monetary interests in the financial instrument or product discussed in his ...
more


