
More Fear As Stocks Continue Lower
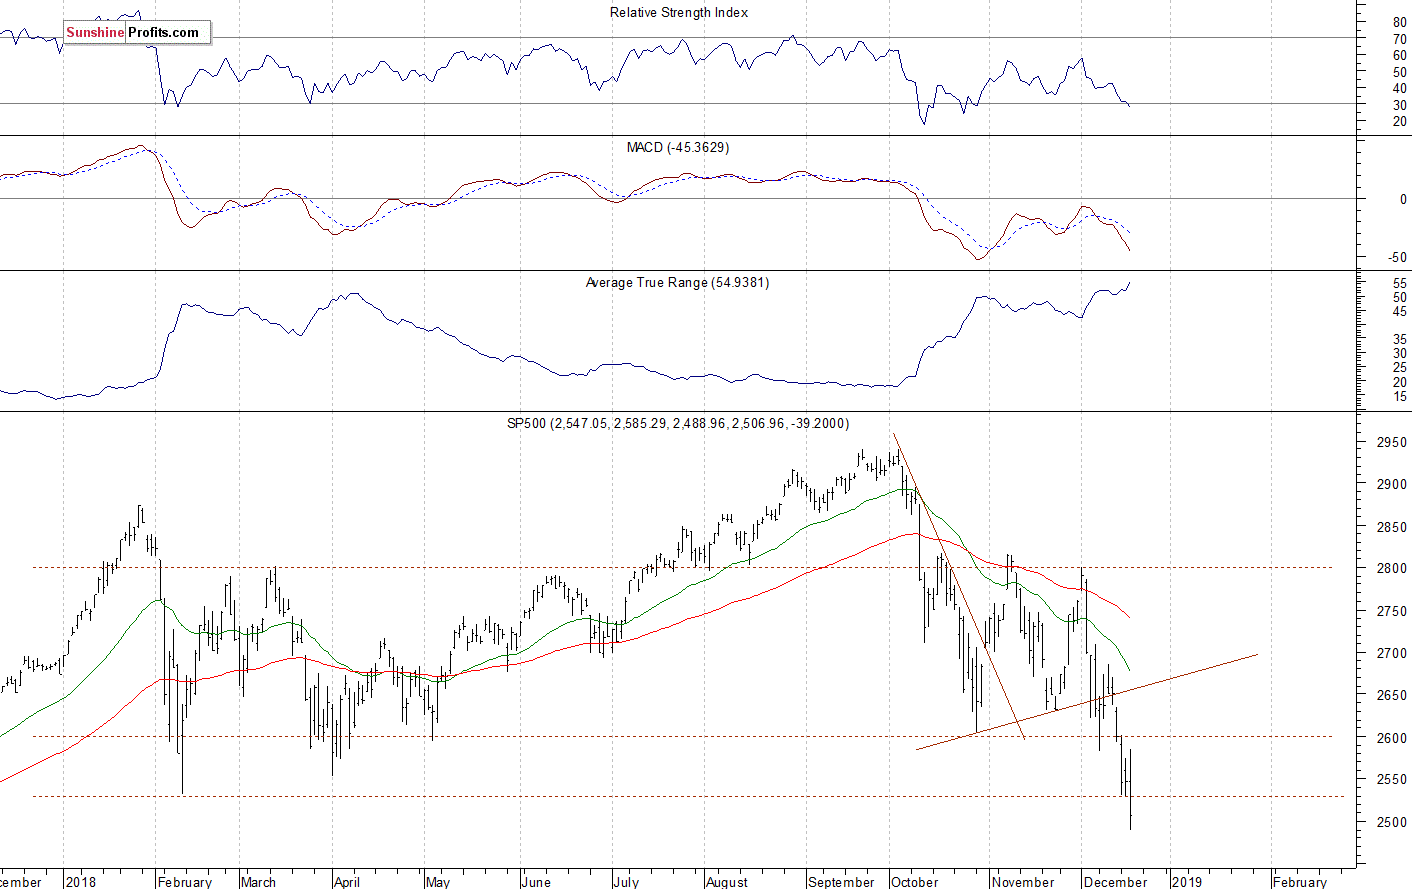
The U.S. stock market indexes lost 1.5-2.2% on Wednesday, as they accelerated their sell-off following the Fed's Rate Decision release. The S&P 500 index fell below the level of 2,500, and it traded 15.4% below September the 21st record high of 2,940.91. The daily low was at 2,488.96. The Dow Jones Industrial Average lost 1.5% and the Nasdaq Composite lost 2.2% on Wednesday.
The nearest important level of resistance of the S&P 500 index is now at 2,530, marked by some recent local lows. The next resistance level is at 2,580-2,600, marked by the previous level of support. On the other hand, the support level remains at 2,490-2,500, marked by some previous medium-term fluctuations. The support level is also at 2,400-2,420, among others.
The broad stock market broke below its two-month-long trading range recently, as the S&P 500 index fell below the level of 2,600. The downward correction reached more than 15% from the September all-time high, surpassing January-February correction of around 12%. Is this a long-term bear market? For now, it looks like a medium-term downward correction. However, there have been no confirmed positive signals so far. The index fell below the February local low, as we can see on the daily chart:
(Click on image to enlarge)
Slightly Positive Expectations Following Wednesday's Sell-Off
The index futures contracts trade between 0.1% and +0.3% vs. their Wednesday's closing prices. So expectations before the opening of today's trading session are virtually flat to slightly positive. The European stock market indexes have lost 0.3-1.3% so far. Investors will wait for some economic data announcements this morning: Initial Claims, Philadelphia Fed Manufacturing Index at 8:30 a.m., CB Leading Index at 10:00 a.m. The broad stock market may fluctuate along the level of 2,500 for some time. There will likely be attempts at retracing some of the recent decline. However, there have been no confirmed positive signals so far.
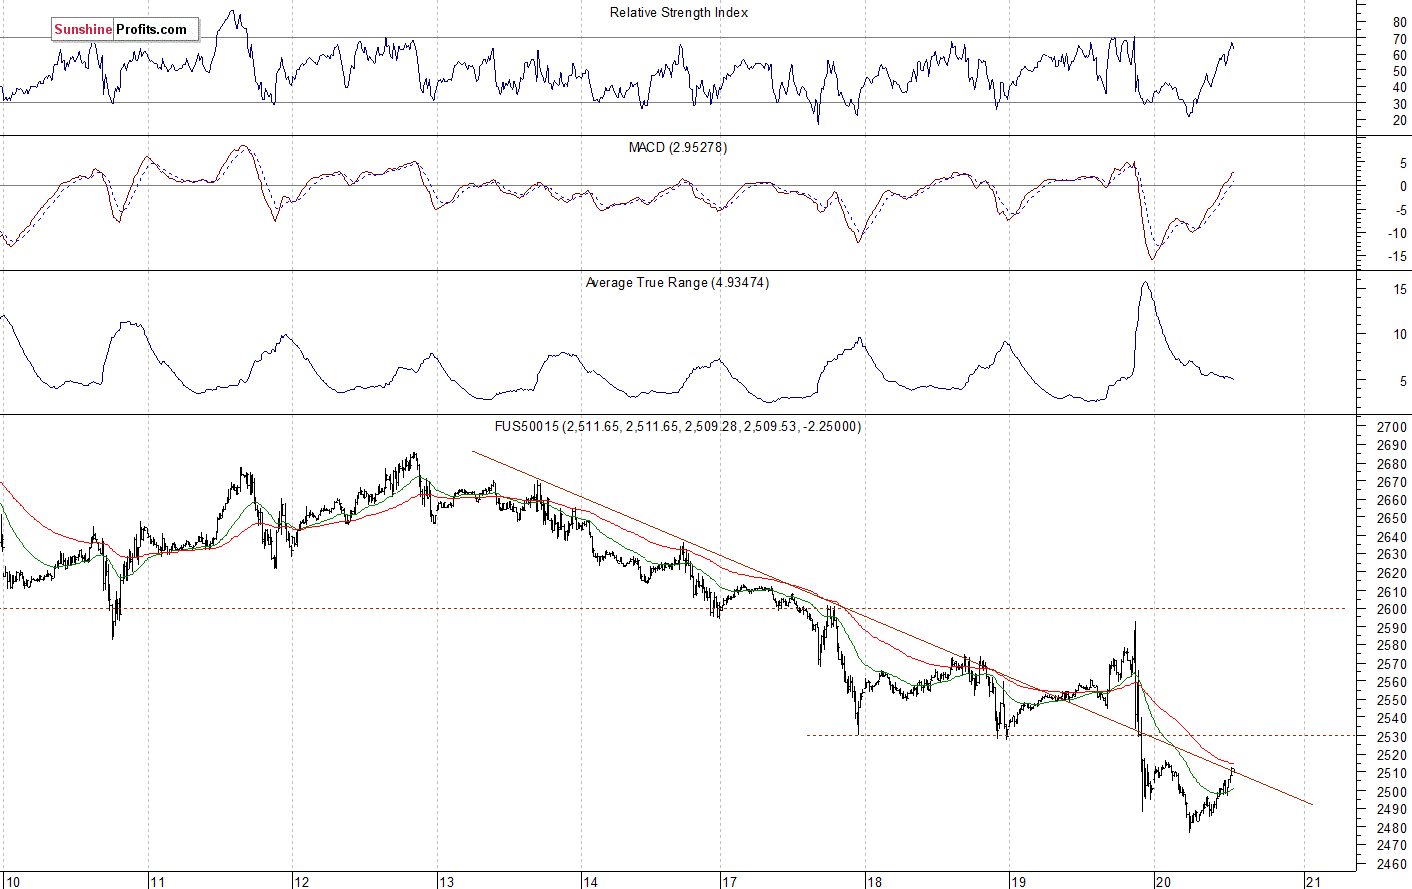
The S&P 500 futures contract trades within an intraday uptrend, as it retraces some of an overnight decline. The nearest important level of resistance is now at 2,500-2,515, marked by the local high. On the other hand, the support level is at 2,475-2,480, among others. The futures contract trades below its recent local lows, as the 15-minute chart shows:
(Click on image to enlarge)
Nasdaq Also Slightly Higher
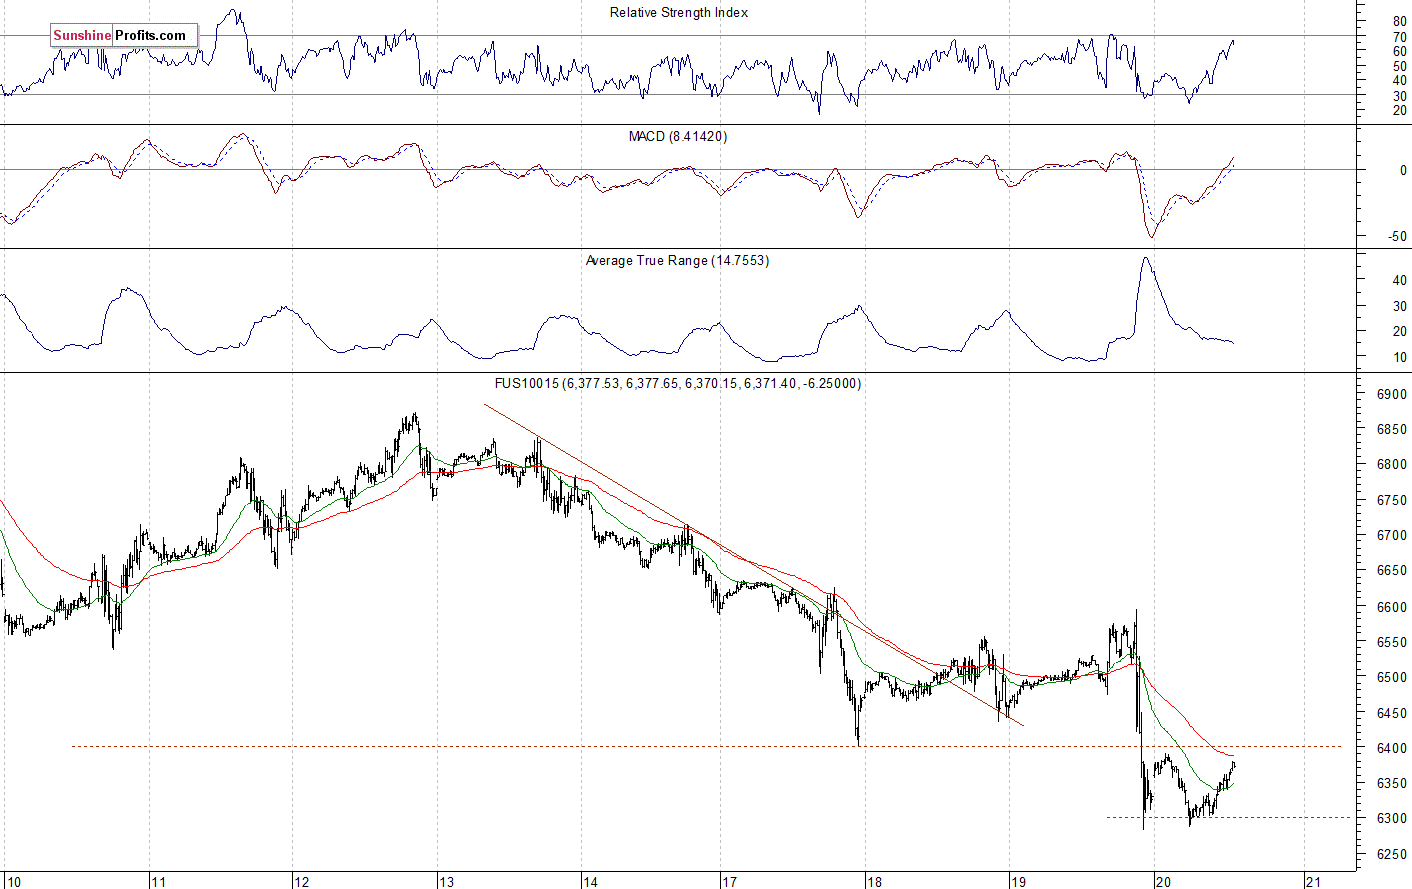
The technology Nasdaq 100 futures contract follows a similar path, as it retraces some of its overnight decline. The market fell below the level of 6,300 yesterday, as it traded over 14% below the early October record high. The nearest important level of resistance is now at around 6,350-6,400. On the other hand, the support level is at6,250-6,300, among others. The Nasdaq futures contract trades within a flat correction of the recent declines, as we can see on the 15-minute chart:
(Click on image to enlarge)
Apple, Amazon - Another Sell-Off
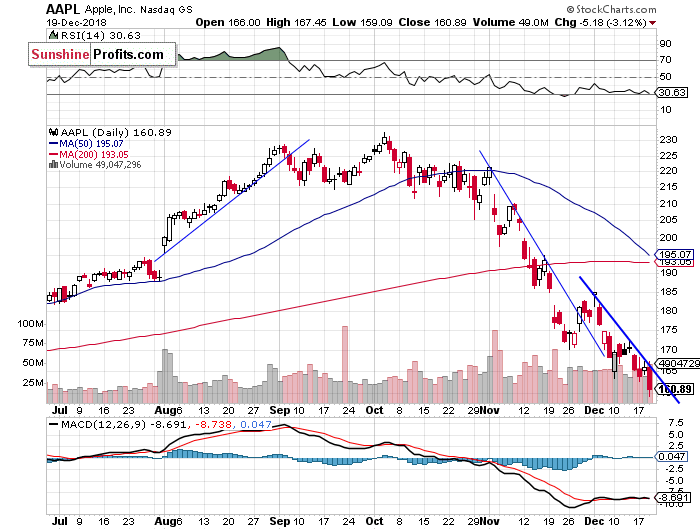
Let's take a look at Apple, Inc. stock (AAPL) daily chart (chart courtesy of http://stockcharts.com). The stock extended its sell-off yesterday, as it fell below the price of $160. The market reached new medium-term low of $159.09. Will it continue lower? There have been no confirmed positive signals so far:
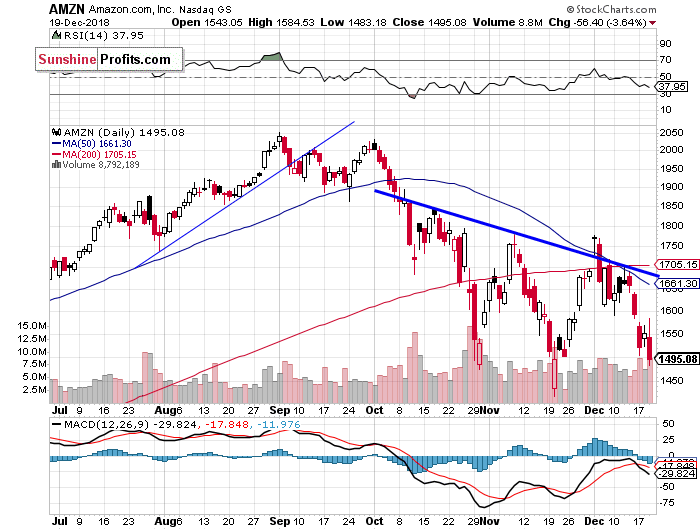
Now let's take a look at Amazon.com, Inc. stock (AMZN) daily chart. The stock bounced off the resistance level of $1,700-1,800 recently, and it got closer to the support level of $1,450-1,500 again. It continues to trade below the two-month-long downward trend line, as we can see on the daily chart:
Dow Jones at New Low
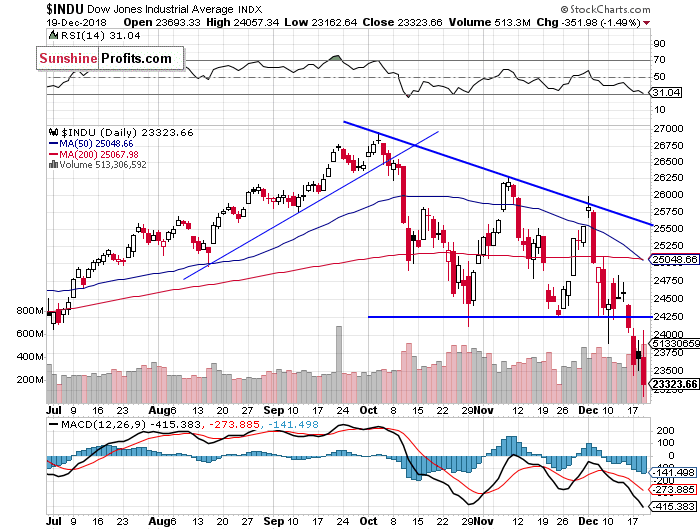
The Dow Jones Industrial Average broke below its two-month-long consolidation on Monday. The blue-chip stocks' gauge fell below the support level of 24,000. The nearest important level support remains at around 23,300-23,350, marked by some previous local lows. On the other hand, the short-term resistance level remains at 24,000-24,250, as the daily chart shows:
Japanese Nikkei Selling Off
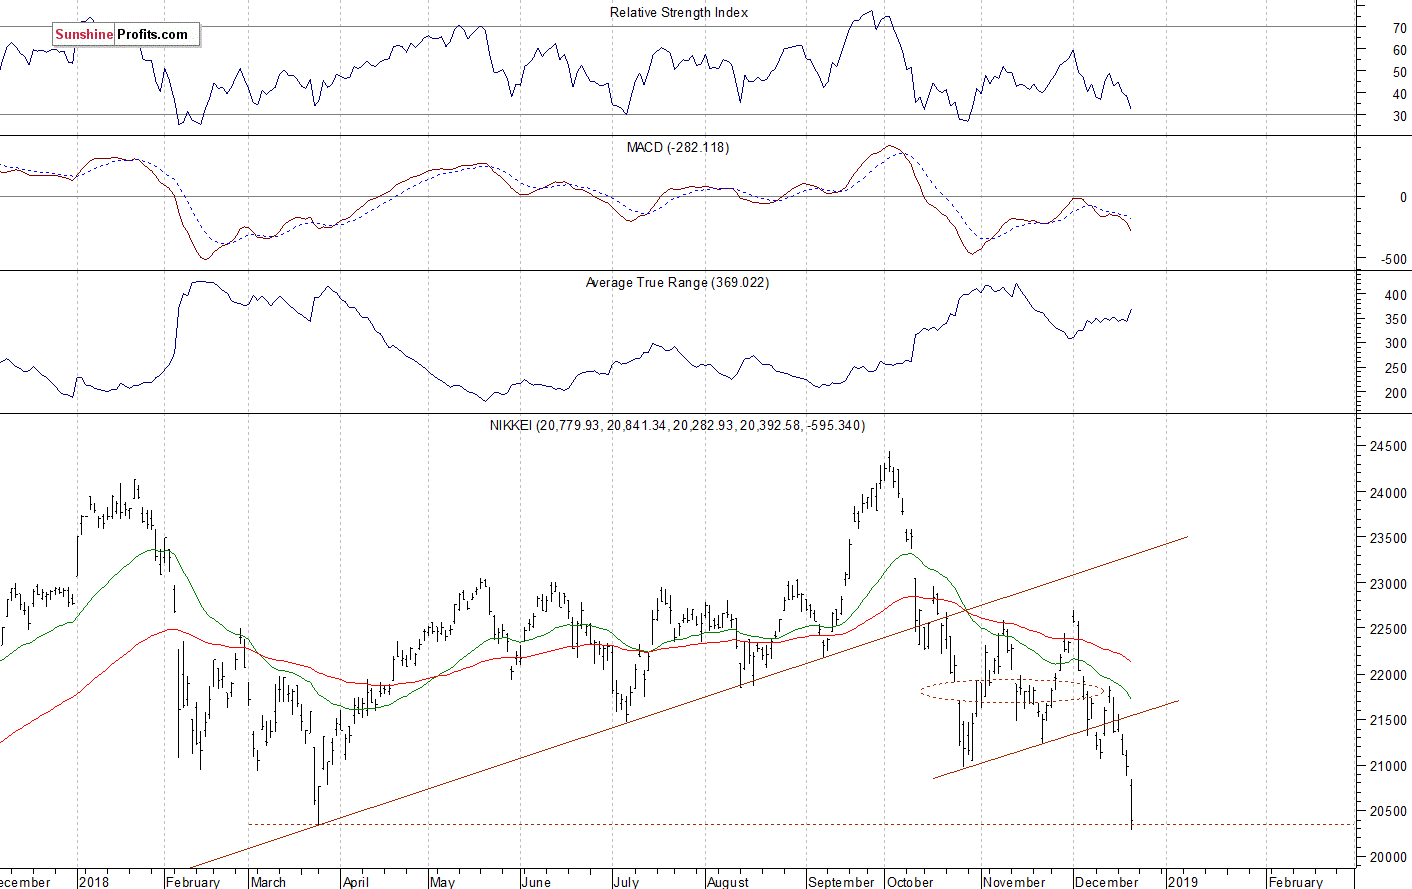
Let's take a look at the Japanese Nikkei 225 index. It accelerated the downtrend today, as it fell the lowest since the late September of 2017. Earlier the market broke below the two-month-long bear flag pattern. The nearest important level of resistance is now at around 20,850, marked by the daily gap down. On the other hand, a support level is now at 20,000:
(Click on image to enlarge)
The S&P 500 index broke below the level of 2,500 yesterday, following the Fed's Rate Decision release. The broad stock market's gauge extended its downtrend, as it fell more than 15% off the late September local high. Is this a long-term bear market or just medium-term downward correction? For now, it looks like a correction. However, there have been no confirmed positive signals so far.
Concluding, the S&P 500 index will likely open slightly higher today. We may see an attempt at retracing some of the recent sell-off. But for now, it only looks like another dead-cat-bounce upward correction.
Disclosure: None.


I have to admit, this continued downtrend is starting to get me a little freaked! I'm new to investing but all my investments are down right now.