More Divergences
Earlier this week, we highlighted some of the key divergences that we see amidst the equity market. Today we’ll point out some more.
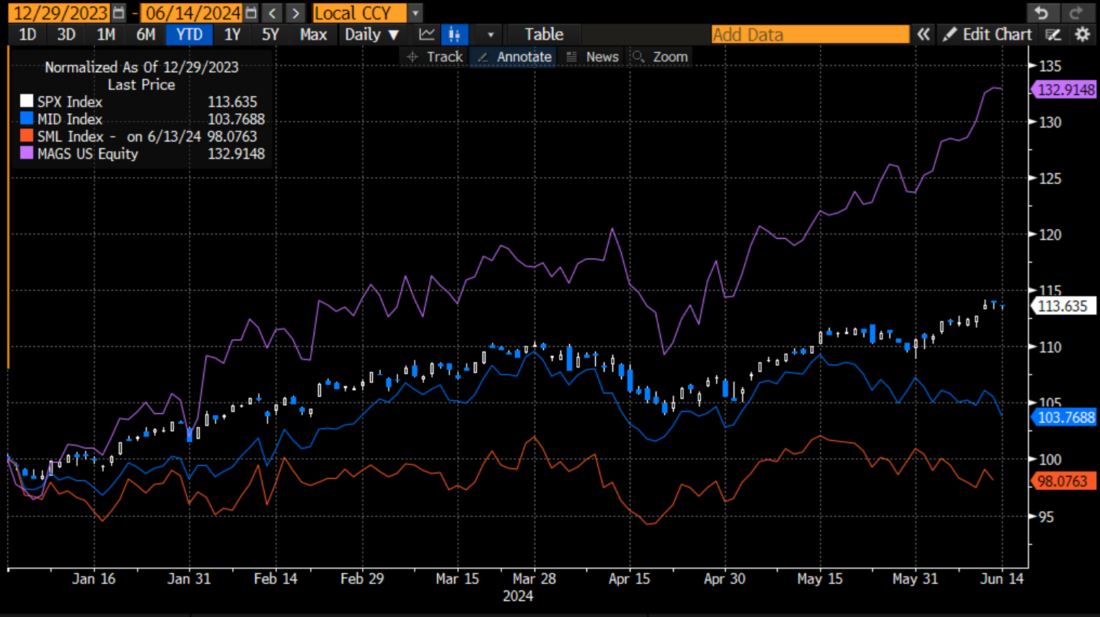
A key point that we made in the prior piece was that the current rally has become increasingly top-heavy. The large-cap S&P 500 Index (SPX) has outpaced its Midcap (MID) and Small Cap (SML) counterparts, while all are being trounced by the Magnificent 7 ETF (MAGS). The current year-to-date performances are +13.5%, +3.8%, -1.93%, and +33%.
Year-to-date Normalized Chart, SPX (white), MID (blue), SML (red), MAGS (purple)
(Click on image to enlarge)

Source: Bloomberg
The positive takeaway from that chart is that if you’ve invested in the correct stocks, particularly if they’re large, AI-related tech stocks, you’ve done superbly. I’ve said many times before that “it’s Nvidia’s (NVDA) market and we’re all just trading in it”. Sure, it’s not only NVDA. Lately, it’s Apple (AAPL) and Broadcom (AVGO), among others, but they’re all singing from the same artificial intelligence hymnal. And so are many investors.
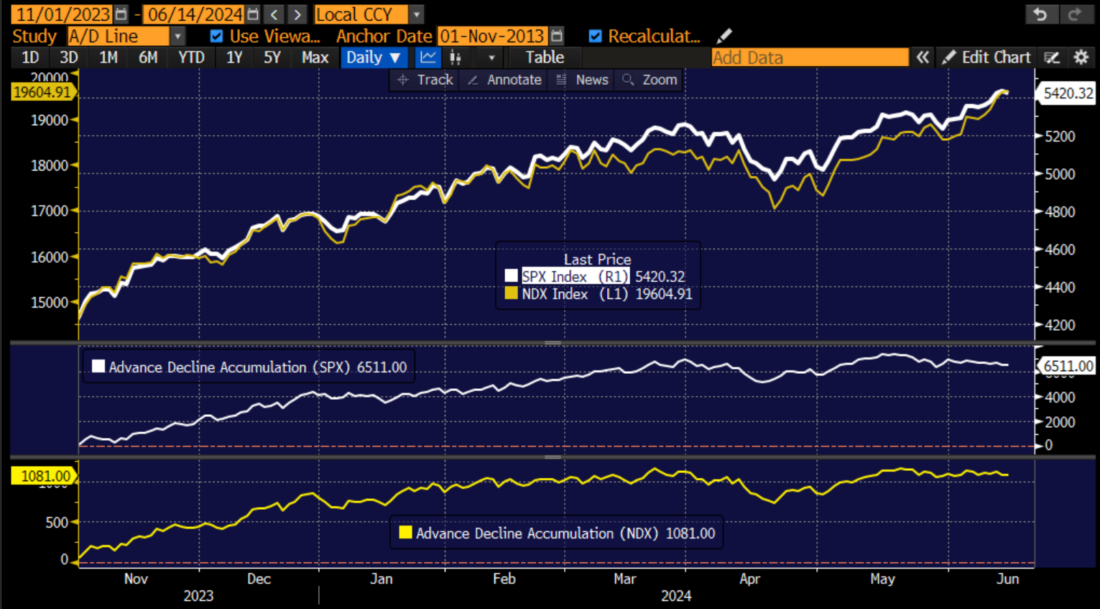
Unfortunately, we found another chart that points the narrowing leadership. The top portion of the chart shows the performance of SPX and the Nasdaq 100 (NDX) indices since the current rally began on November 1st of last year. The lower charts show the cumulative advance/decline lines of both indices. We see how the respective A/D lines roughly track the indices, moving higher along when the index advanced and falling when it fell. But something changed in mid-May. The A/D lines stopped following their corresponding indices. Both have so far failed to confirm the indices’ current peaks and are actually slightly lower.
SPX (white) and NDX (yellow) Since November 1, 2023, with Respective Cumulative Advance/Decline Lines Below
(Click on image to enlarge)

Source: Bloomberg
This doesn’t prove that we are in imminent danger, but this is a negative sign. This can only occur if the larger, more heavily weighted index leaders lead the advance, even if the others lag. It is wonderful when it works, but treacherous. If everyone is fully long a narrow group of market leaders, who is left to buy them if they stop going up? Or fall?
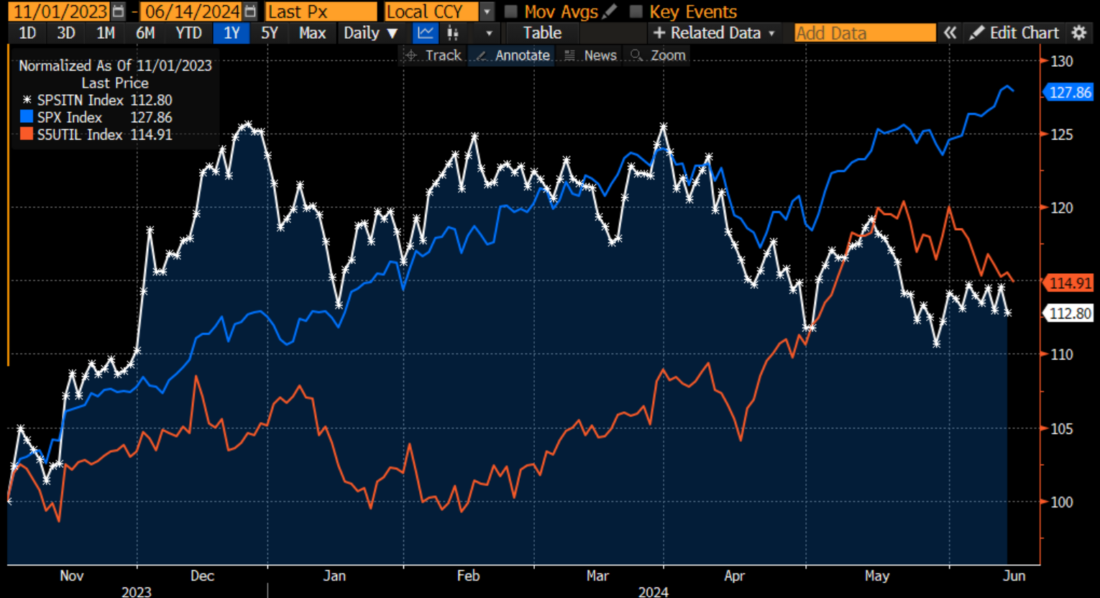
Finally, we will highlight a version of the old-school Dow Theory. It posits that new highs in the Dow Jones Industrial Average (INDU) need to be confirmed by highs in the Dow Transports and Utilities. I agree with the basic merits of the theory since those two sectors reflect the general health of the economy, but since I loathe the price-weighted construction of those “indices”, we will use SPX alongside its Transportation and Utilities components. We see that the transports stopped confirming the advance when we bounced off the April lows, and after a brief AI-fueled enthusiasm, we now see the utilities failing to confirm as well:
SPX (blue) Since November 1, 2023, with S&P Transportation (white) and S&P Utilities (red)
(Click on image to enlarge)

Bottom line here, there are many signs of weakness that would give pause to a long-time market watcher. This is why, on the morning after the FOMC meeting, I asserted that the market rally is dependent on AI, not rate cuts. Yes, “it’s NVDA’s market and we’re all just trading in it”, so we need to be very wary if the enthusiasm wanes.
More By This Author:
Powell Sparks Risk-Off Trading
What Can The FOMC Do For An Encore?
It’s About Owning The Correct Stocks
Disclosure: The analysis in this material is provided for information only and is not and should not be construed as an offer to sell or the solicitation of an offer to buy any security. To the ...
more


