
Micro-Cap ETFs
TM editors' note: This article discusses a penny stock and/or microcap. Such stocks are easily manipulated; do your own careful due diligence.
Micro-cap stocks generally refer to U.S. publicly traded companies with a market capitalization between $50 million and $500 million. Micro-cap ETFs are exchange-traded funds that focus on this segment of the market. However, most micro-cap indexes target specific deciles of capitalization, or exclude a fixed quantity of larger stocks, so the actual upper bound often approaches $1 billion.
Companies with a market capitalization of less than $50 million are often labeled nano-cap stocks, although some sources will include these smaller stocks within the micro-cap classification.
Because of their sheer numbers and small market values, these stocks often do not receive adequate coverage by Wall Street analysts and brokerage houses. Reduced coverage means less scrutiny, lower liquidity, higher volatility, and increased risk. The SEC publication “Microcap Stock: A Guide for Investors” provides potential investors with information on regulation, trading, and risks of investing in these securities. One of the primary benefits of using ETFs to get exposure to this area of the market is the single-security risk mitigation provided by the diversification achieved from owning hundreds of these stocks.
There are currently four U.S.-listed micro-cap ETFs, and all have been on the market for a minimum of 10 years. Here they are listed in order of fund asset size:
iShares Micro-Cap ETF (IWC), launched 8/17/2005, seeks to track the Russell Microcap Index, which excludes the 2,000 largest U.S.-listed companies by market capitalization. The ETF holds 1,352 stocks with an average market capitalization of $463 million. It has $850 million in assets and an expense ratio of 0.60% (IWC overview).
First Trust Dow Jones Select MicroCap (FDM), launched 9/30/2005, seeks to track the Dow Jones Select Microcap Index, which is designed to represent U.S.-listed micro-cap stocks that are liquid and have strong fundamentals relative to the micro-cap segment as a whole. It covers securities whose market capitalizations fall within a range defined by the bottom two deciles of NYSE stocks. It uses a multifactor screen of fundamentals, momentum, and liquidity to arrive at an ETF holding 515 stocks with an average market capitalization of $515 million. It has $82 million in assets and an expense ratio of 0.60% (FDM overview).
Guggenheim Wilshire Micro-Cap (WMCR), launched 9/21/2006, seeks to track the Wilshire Micro-Cap Index, which excludes the 2,500 largest components of the Wilshire 5000 Index. The ETF holds 802 stocks with an average market capitalization of $187 million (the smallest of the four Micro-Cap ETFs). It has assets of $27 million and an expense ratio of 0.59% (WMCR overview).
PowerShares Zacks Micro Cap (PZI), launched 8/18/2005, tracks an index designed to identify a group of micro-cap stocks with the greatest potential to outperform passive benchmark micro-cap indexes and other actively managed U.S. micro-cap strategies. The ETF holds 401 stocks with an average market capitalization of $427 million. It has just $25 and an expense ratio of 0.50% (PZI overview).
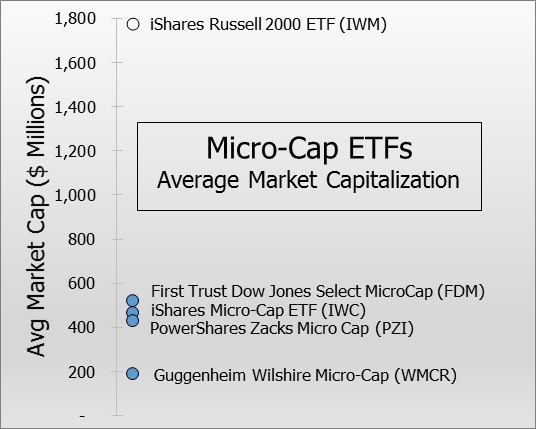
The accompanying chart shows that the average market capitalization of these ETFs typically falls in the $400 million to $500 million range. The primary exception is the Guggenheim Wilshire Micro-Cap ETF (WMCR) with its $187 million average market capitalization. For reference, the chart also includes the iShares Russell 2000 ETF (IWM). The Russell 2000 Index is the most widely followed benchmark of small-cap stocks, but with an average market capitalization of $1.7 billion, the Russell 2000 average market capitalization is about four times that of most Micro-Cap benchmarks.
The 2017 “ETF Field Guide” awarded its “best-of-breed” blue star designation in the U.S. Micro-Cap ETF category to First Trust Dow Jones Select MicroCap (FDM). This designation is based on performance and risk, with screening for liquidity and expense ratios. In 2016, FDM returned 35.9%, while the second-place finisher lagged far behind with a 24.1% return. Its 10-year annualized return of 7.3% was 2.1% ahead of its nearest competitor. Its 3-year maximum drawdown was held to 17.8% versus drops of 23.9% to 28.7% for the other three.
For my money, the First Trust Dow Jones Select MicroCap ETF (FDM) is the first place you should look when considering a micro-cap ETF for your portfolio.
Disclosure: more


