
The January Preliminary Report came in at 64.6, up 4.9 (8.2%) from the December Final. Investing.com had forecast 60.5. Since its beginning in 1978, consumer sentiment is 24 percent below the average reading (arithmetic mean) and 23 percent below the geometric mean.
Surveys of Consumers Director, Joanne Hsu, makes the following comments:
Consumer sentiment remained low from a historical perspective but continued lifting for the second consecutive month, rising 8% above December and reaching about 4% below a year ago. Current assessments of personal finances surged 16% to its highest reading in eight months on the basis of higher incomes and easing inflation. Although the short-run economic outlook fell modestly from December, the long-run outlook rose 7% to its highest level in nine months and is now 17% below its historical average.
Year-ahead inflation expectations receded for the fourth straight month, falling to 4.0% in January from 4.4% in December. The current reading is the lowest since April 2021 but remains well above the 2.3-3.0% range seen in the two years prior to the pandemic. Long-run inflation expectations were little changed from December at 3.0%, again staying within the narrow 2.9-3.1% range for 17 of the last 18 months. Long-run inflation expectations remain elevated relative to the 2.2-2.6% range seen in the two years pre-pandemic. Uncertainty over both inflation expectations measures remains high, and changes in global factors in the months ahead may generate a reversal in recent improvements. [More...]
See the chart below for a long-term perspective on this widely watched indicator. Recessions and real GDP are included to help us evaluate the correlation between the Michigan Consumer Sentiment Index and the broader economy.
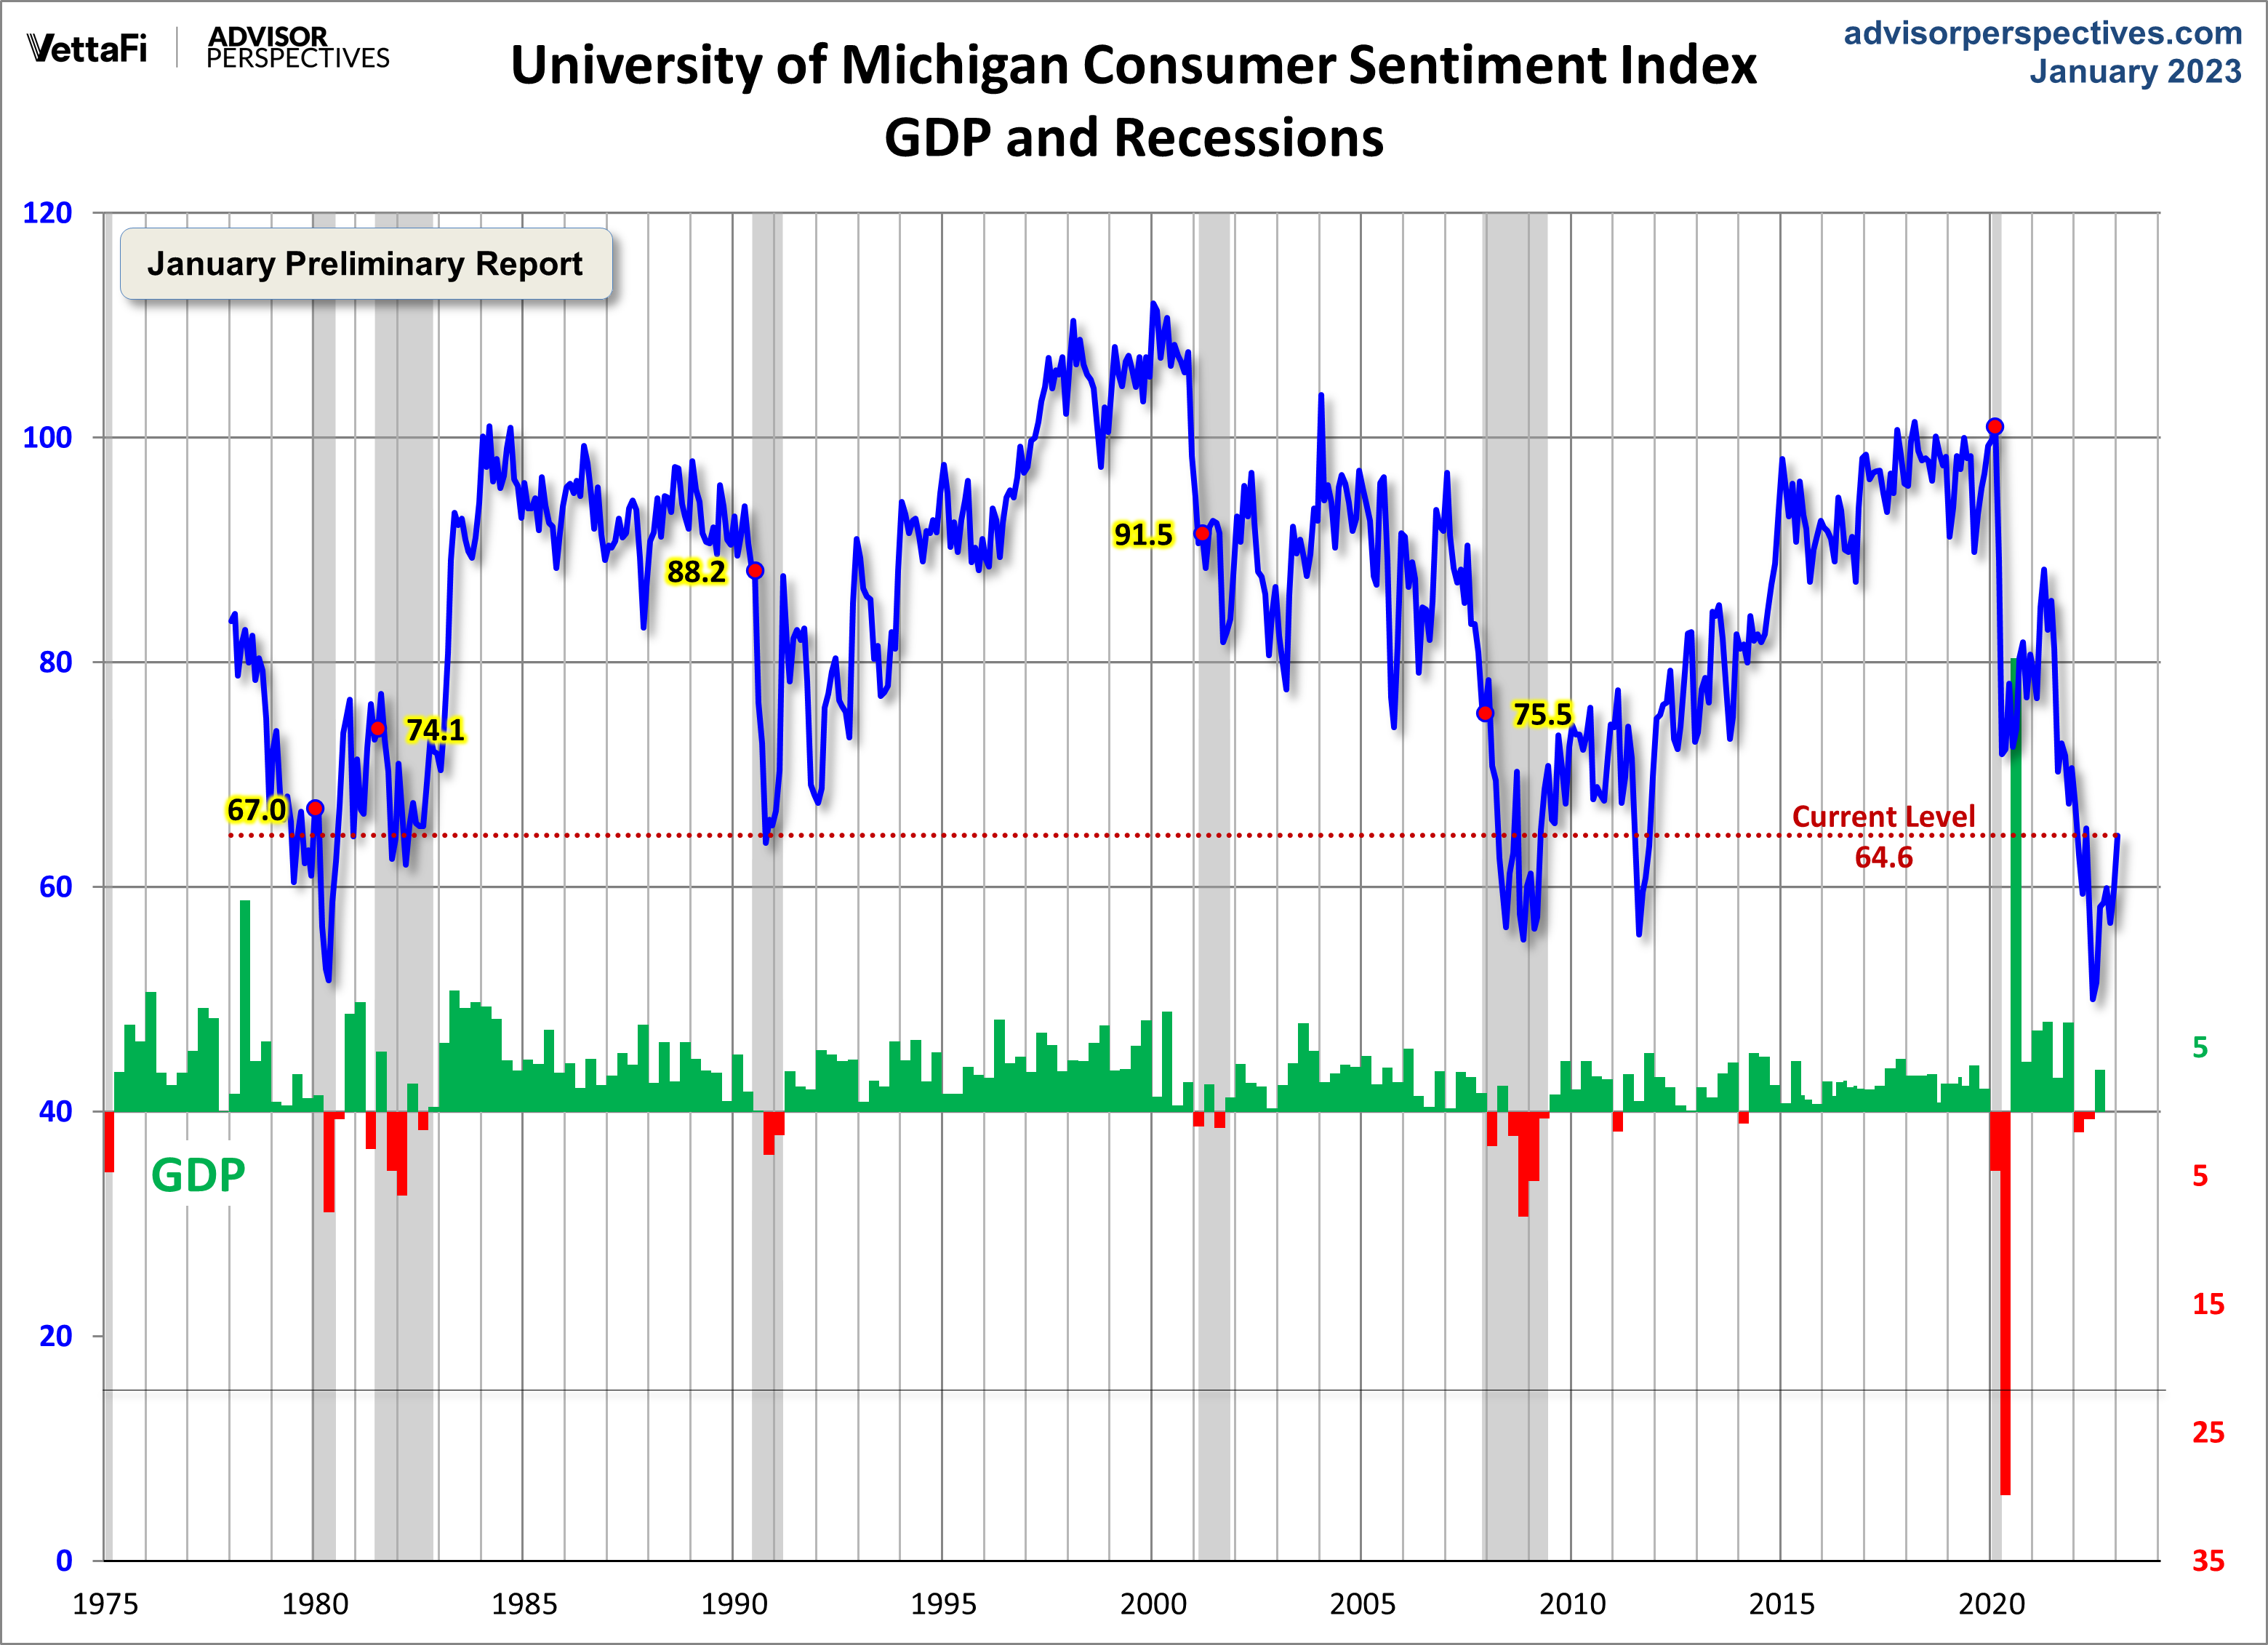
To put today's report into the larger historical context since its beginning in 1978, consumer sentiment is 24 percent below the average reading (arithmetic mean) and 23 percent below the geometric mean. The current index level is at the 8th percentile of the 541 monthly data points in this series.
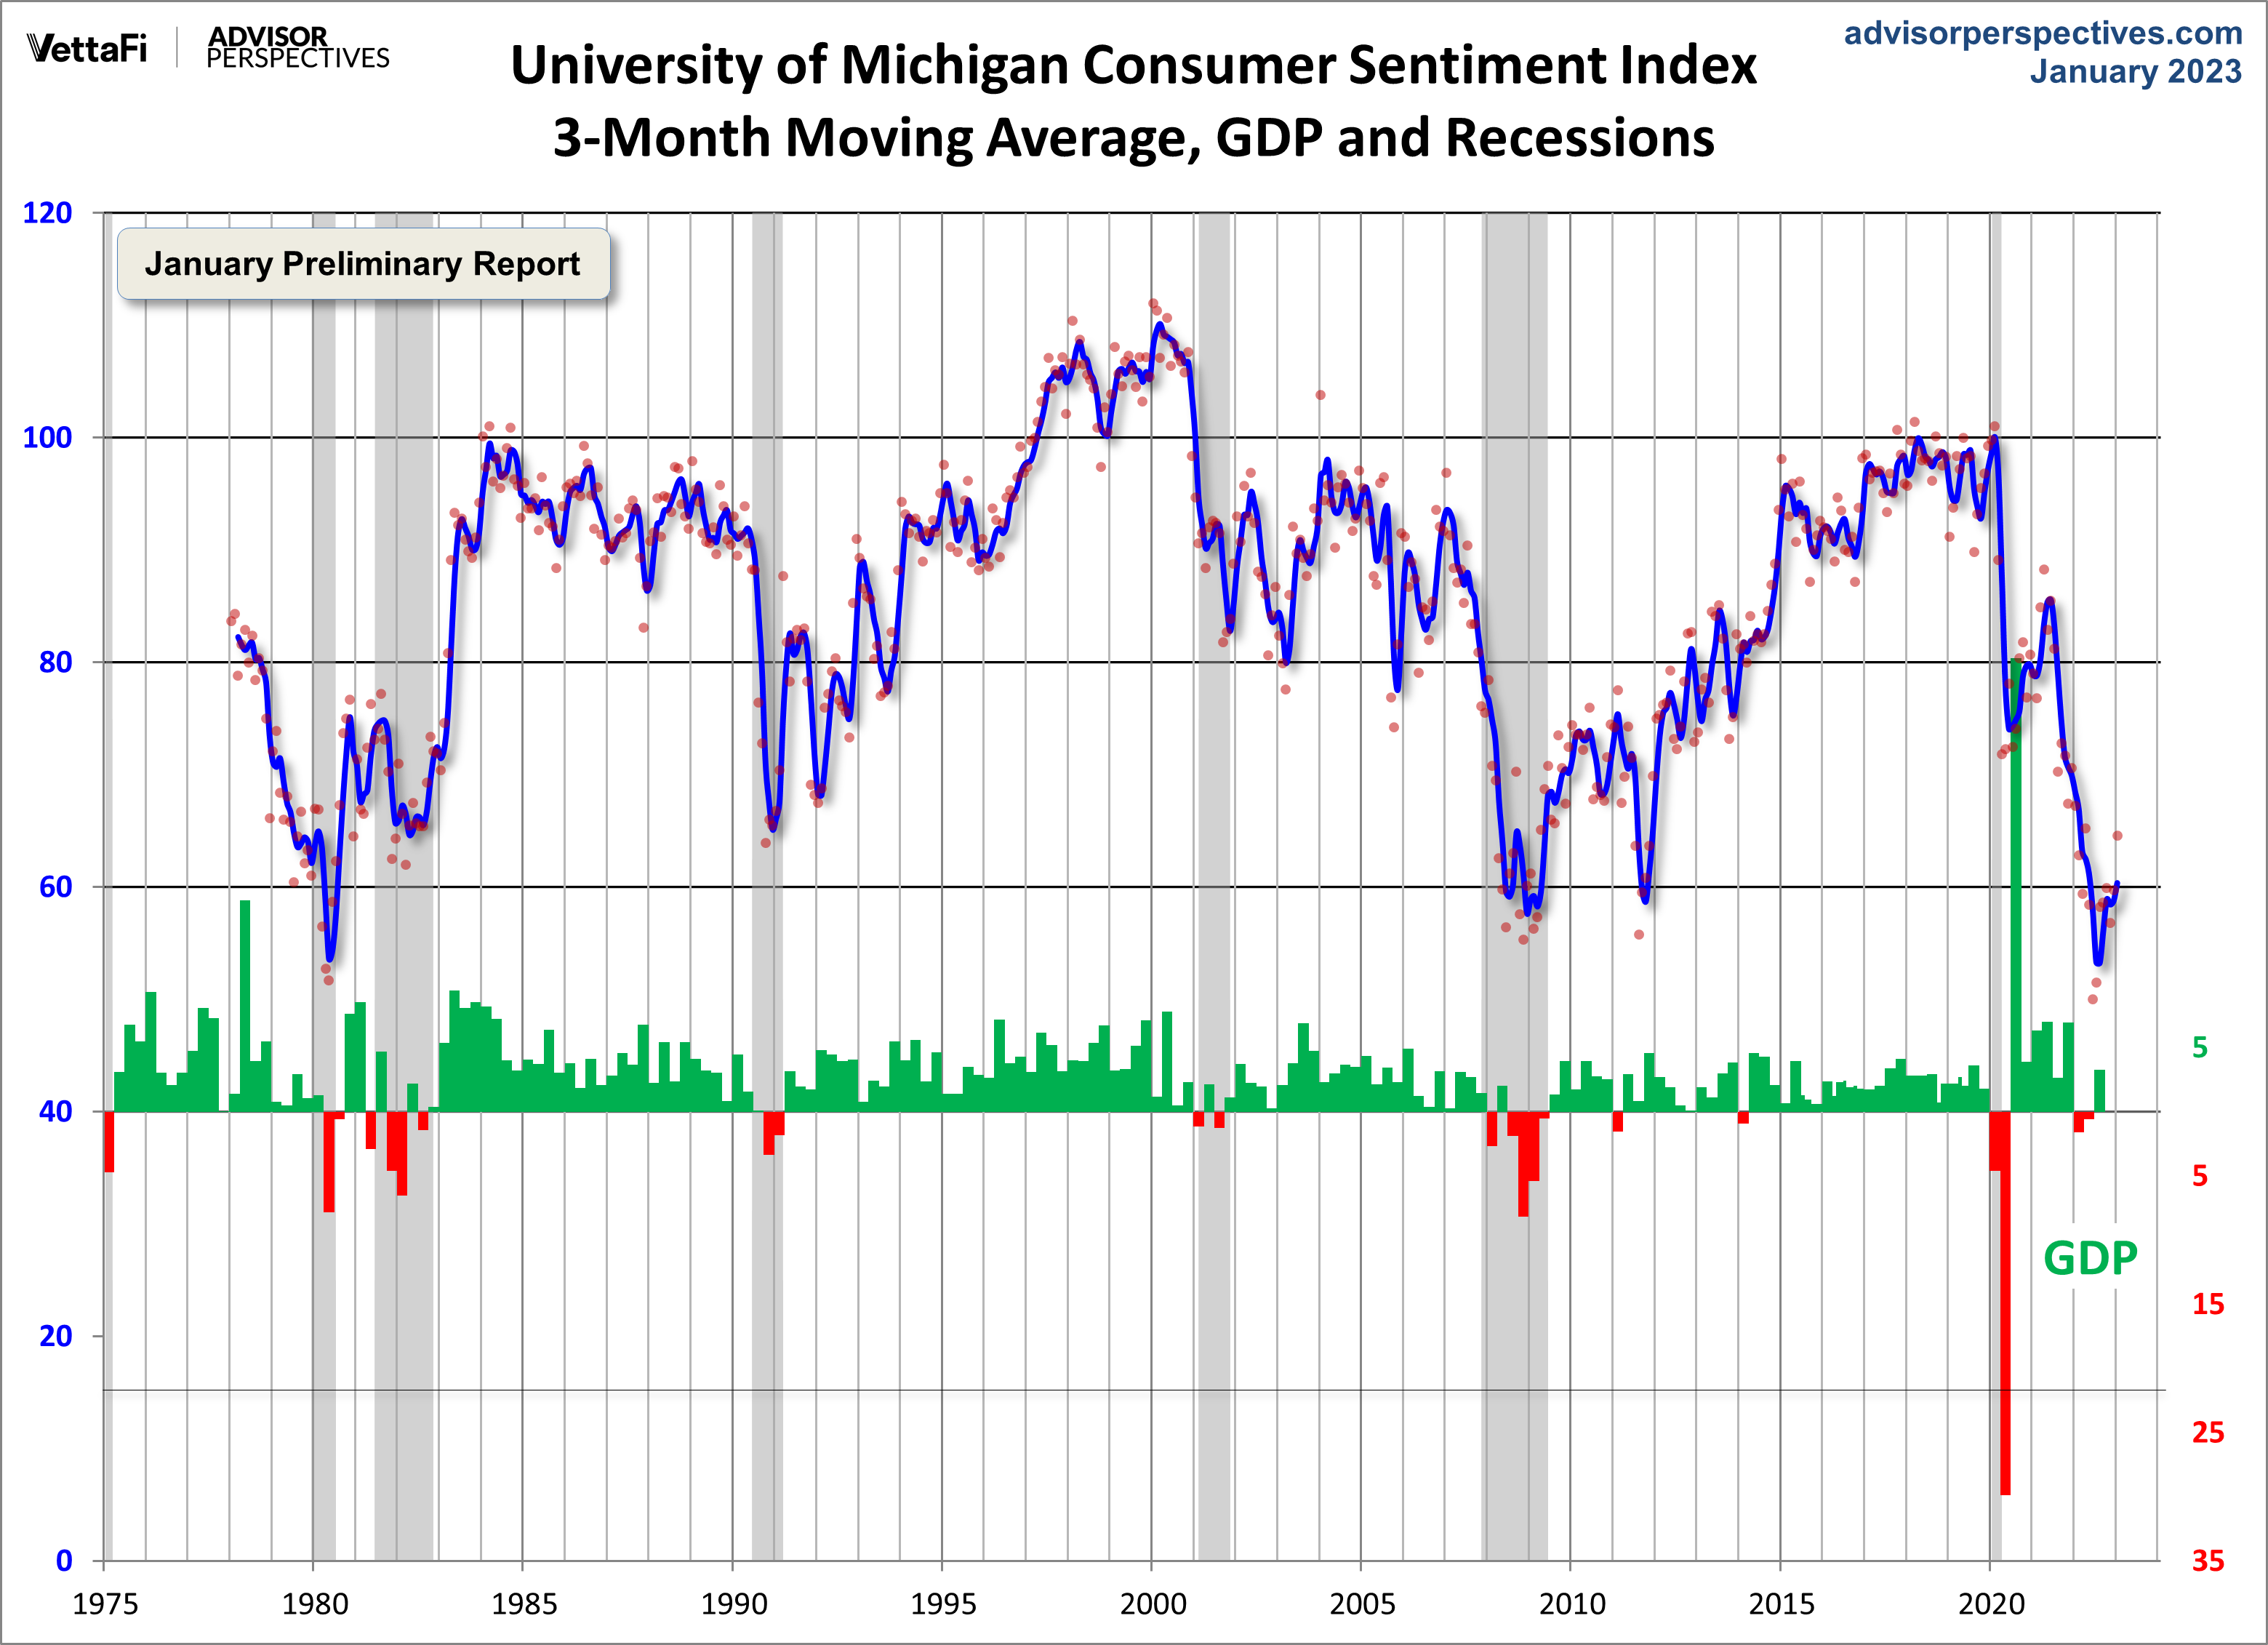
Note that this indicator is somewhat volatile, with a 3.1 point absolute average monthly change. The latest data point saw a 4.9 point increase from the previous month. For a visual sense of the volatility, here is a chart with the monthly data and a three-month moving average.
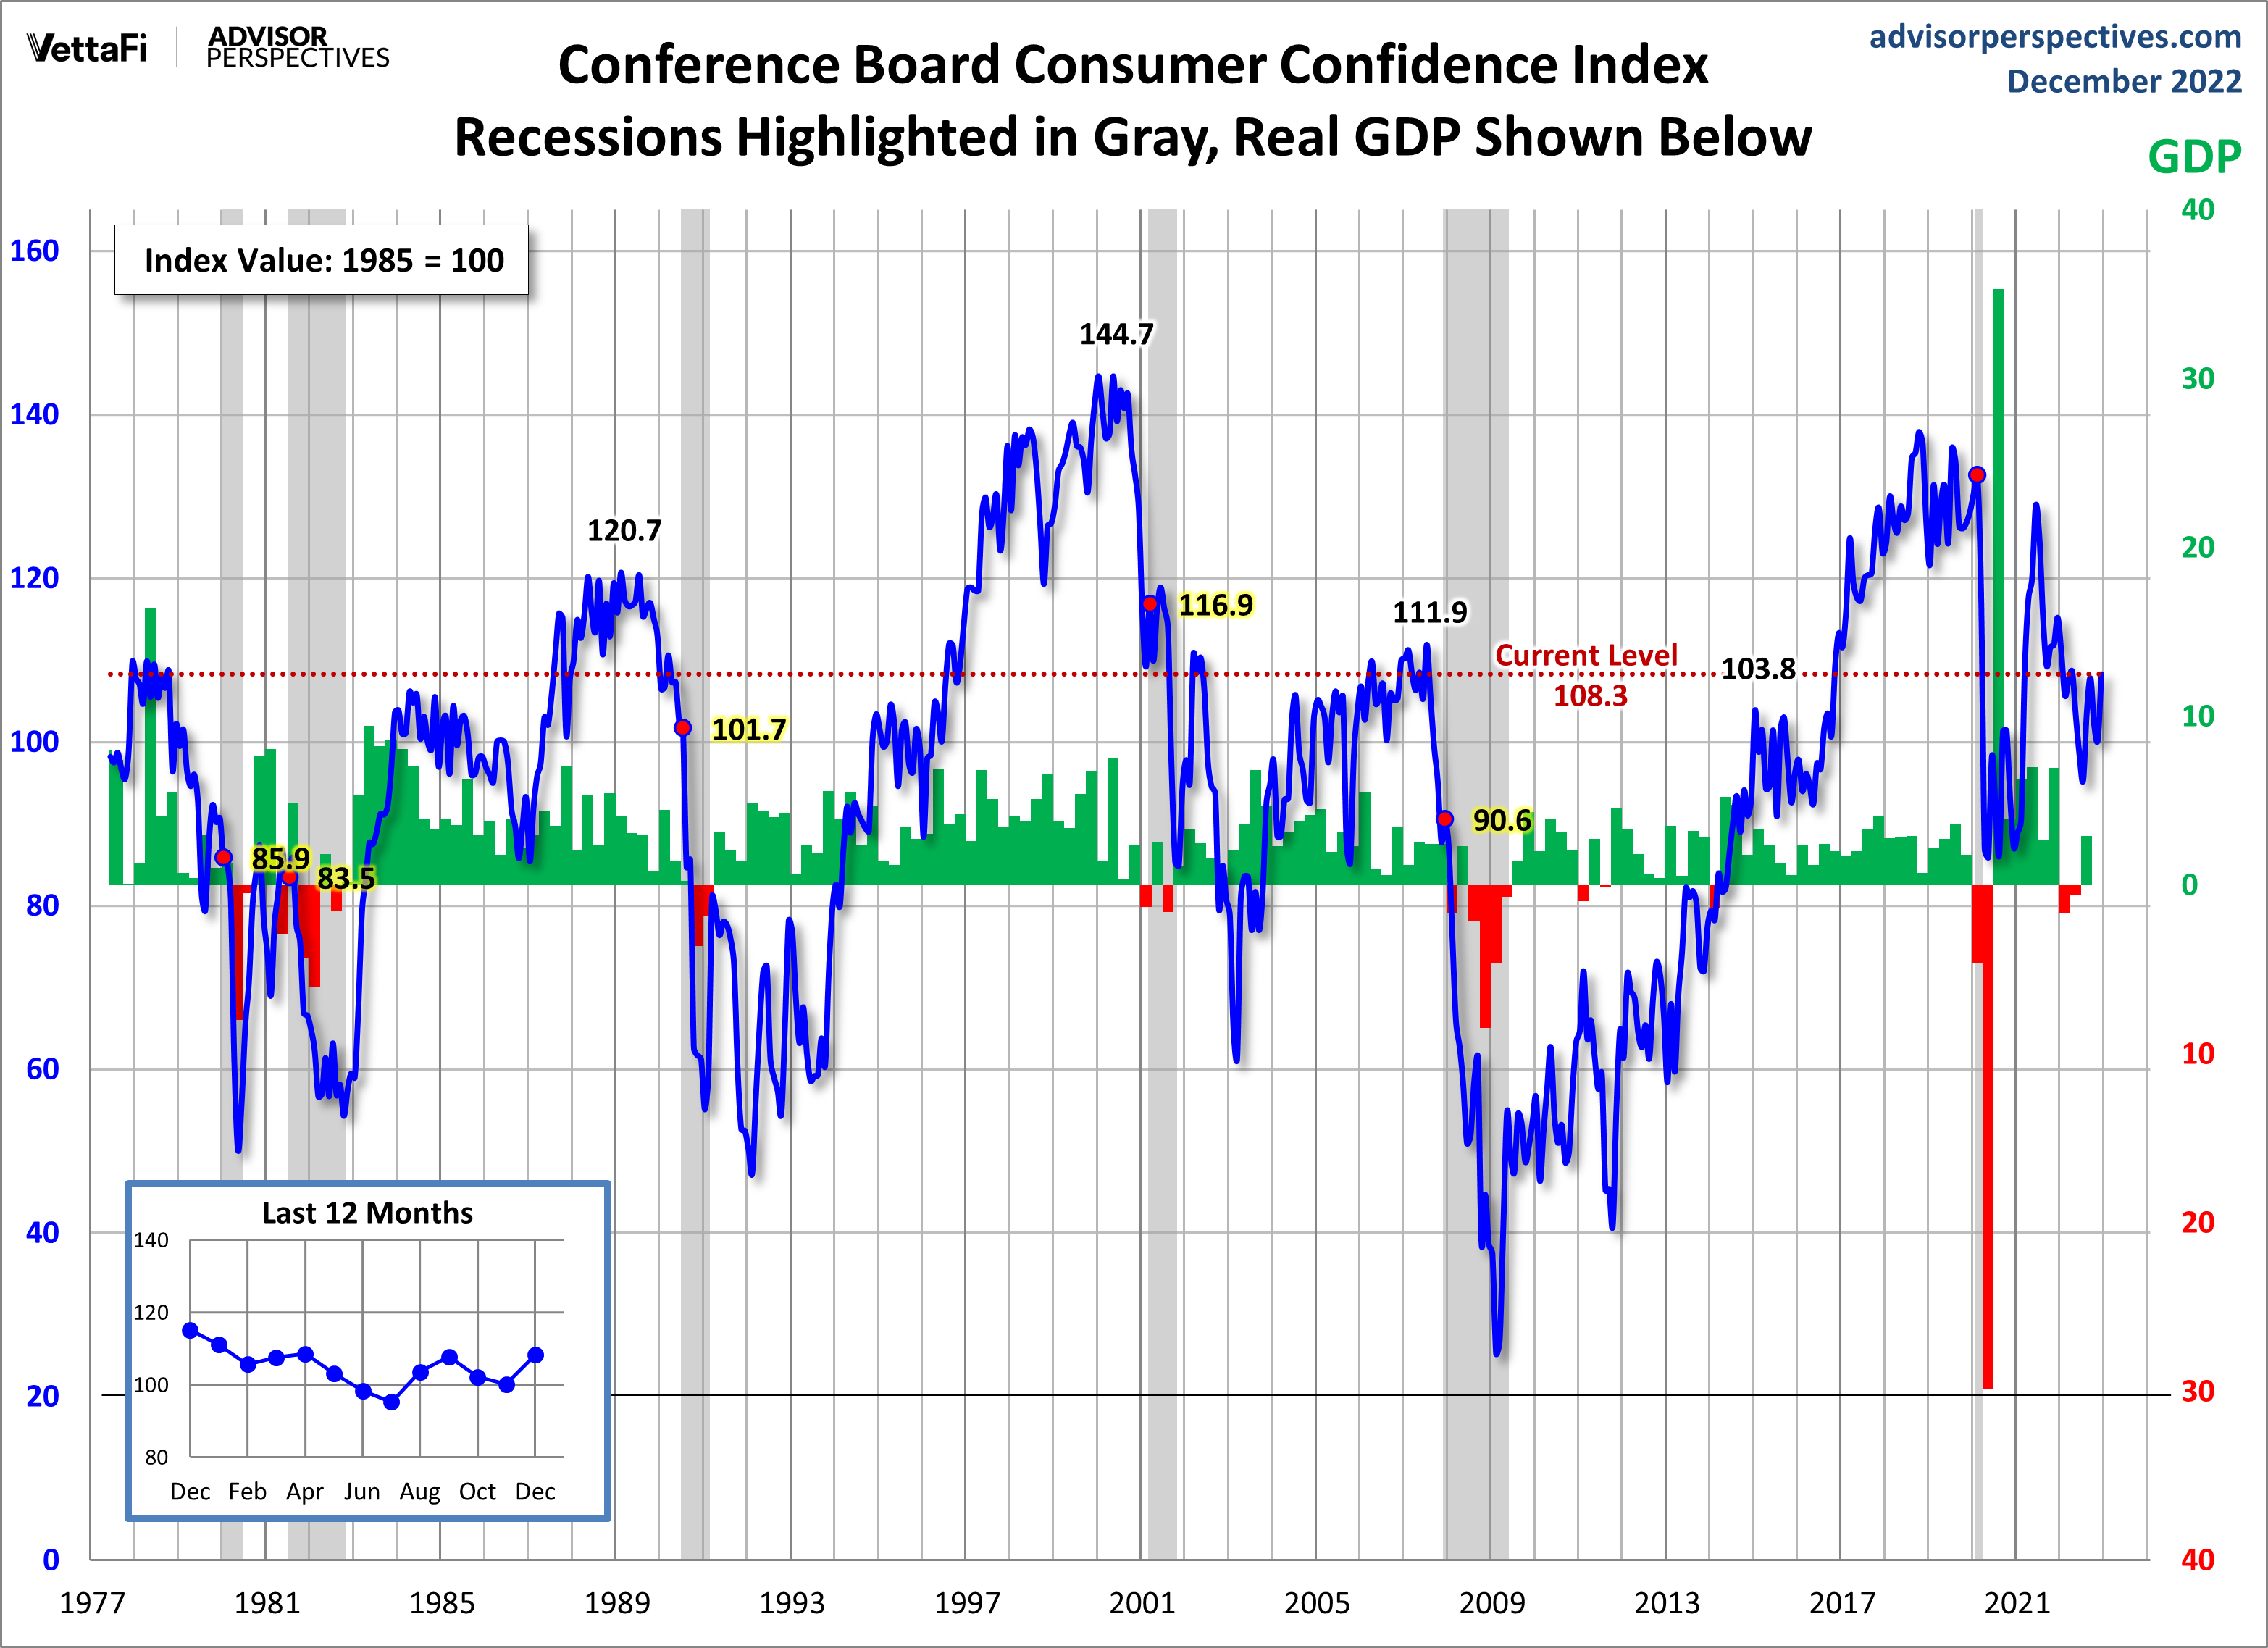
For the sake of comparison, here is a chart of the Conference Board's Consumer Confidence Index (monthly update here). The Conference Board Index is the more volatile of the two, but the broad pattern and general trends have been remarkably similar to the Michigan Index.
And finally, the prevailing mood of the Michigan survey is also similar to the mood of small business owners, as captured by the NFIB Business Optimism Index (monthly update here).

More By This Author:
Underlying Inflation Gauge: December Update - Friday, Jan. 13Baby Boomer Employment - December 2022
Consumer Price Index: December Headline At 6.45%, Down From November


Comments
Log in or sign up to join the conversation.