
The July Final Report came in at 51.5, up 1.5 (3.0%) from the June Final. Investing.com had forecast 51.1. Since its beginning in 1978, consumer sentiment is 39.9 percent below the average reading (arithmetic mean) and 39.1 percent below the geometric mean.
Surveys of Consumers chief economist, Richard Curtin, makes the following comments:
The final July reading showed little change in consumer sentiment from its historic low in June. The one-year economic outlook fell to its lowest reading since 2009. At the same time, concerns over global factors have eased somewhat. This easing provided some limited support to buying conditions for durables, which remained near the all-time low reached last month, as well as a modest retreat in long run inflation expectations. However, inflation continued to dominate consumers’ attention, and labor market expectations continued to soften. This month’s Sentiment Index was the second lowest reading on record, and the Q2 slowdown in personal consumption expenditures was no surprise. The final July reading of the median expected year-ahead inflation rate was 5.2%, little changed from mid-month or the preceding two months. Long run expectations came in at 2.9%, remaining within the 2.9-3.1% range seen in the past 11 months. [More...]
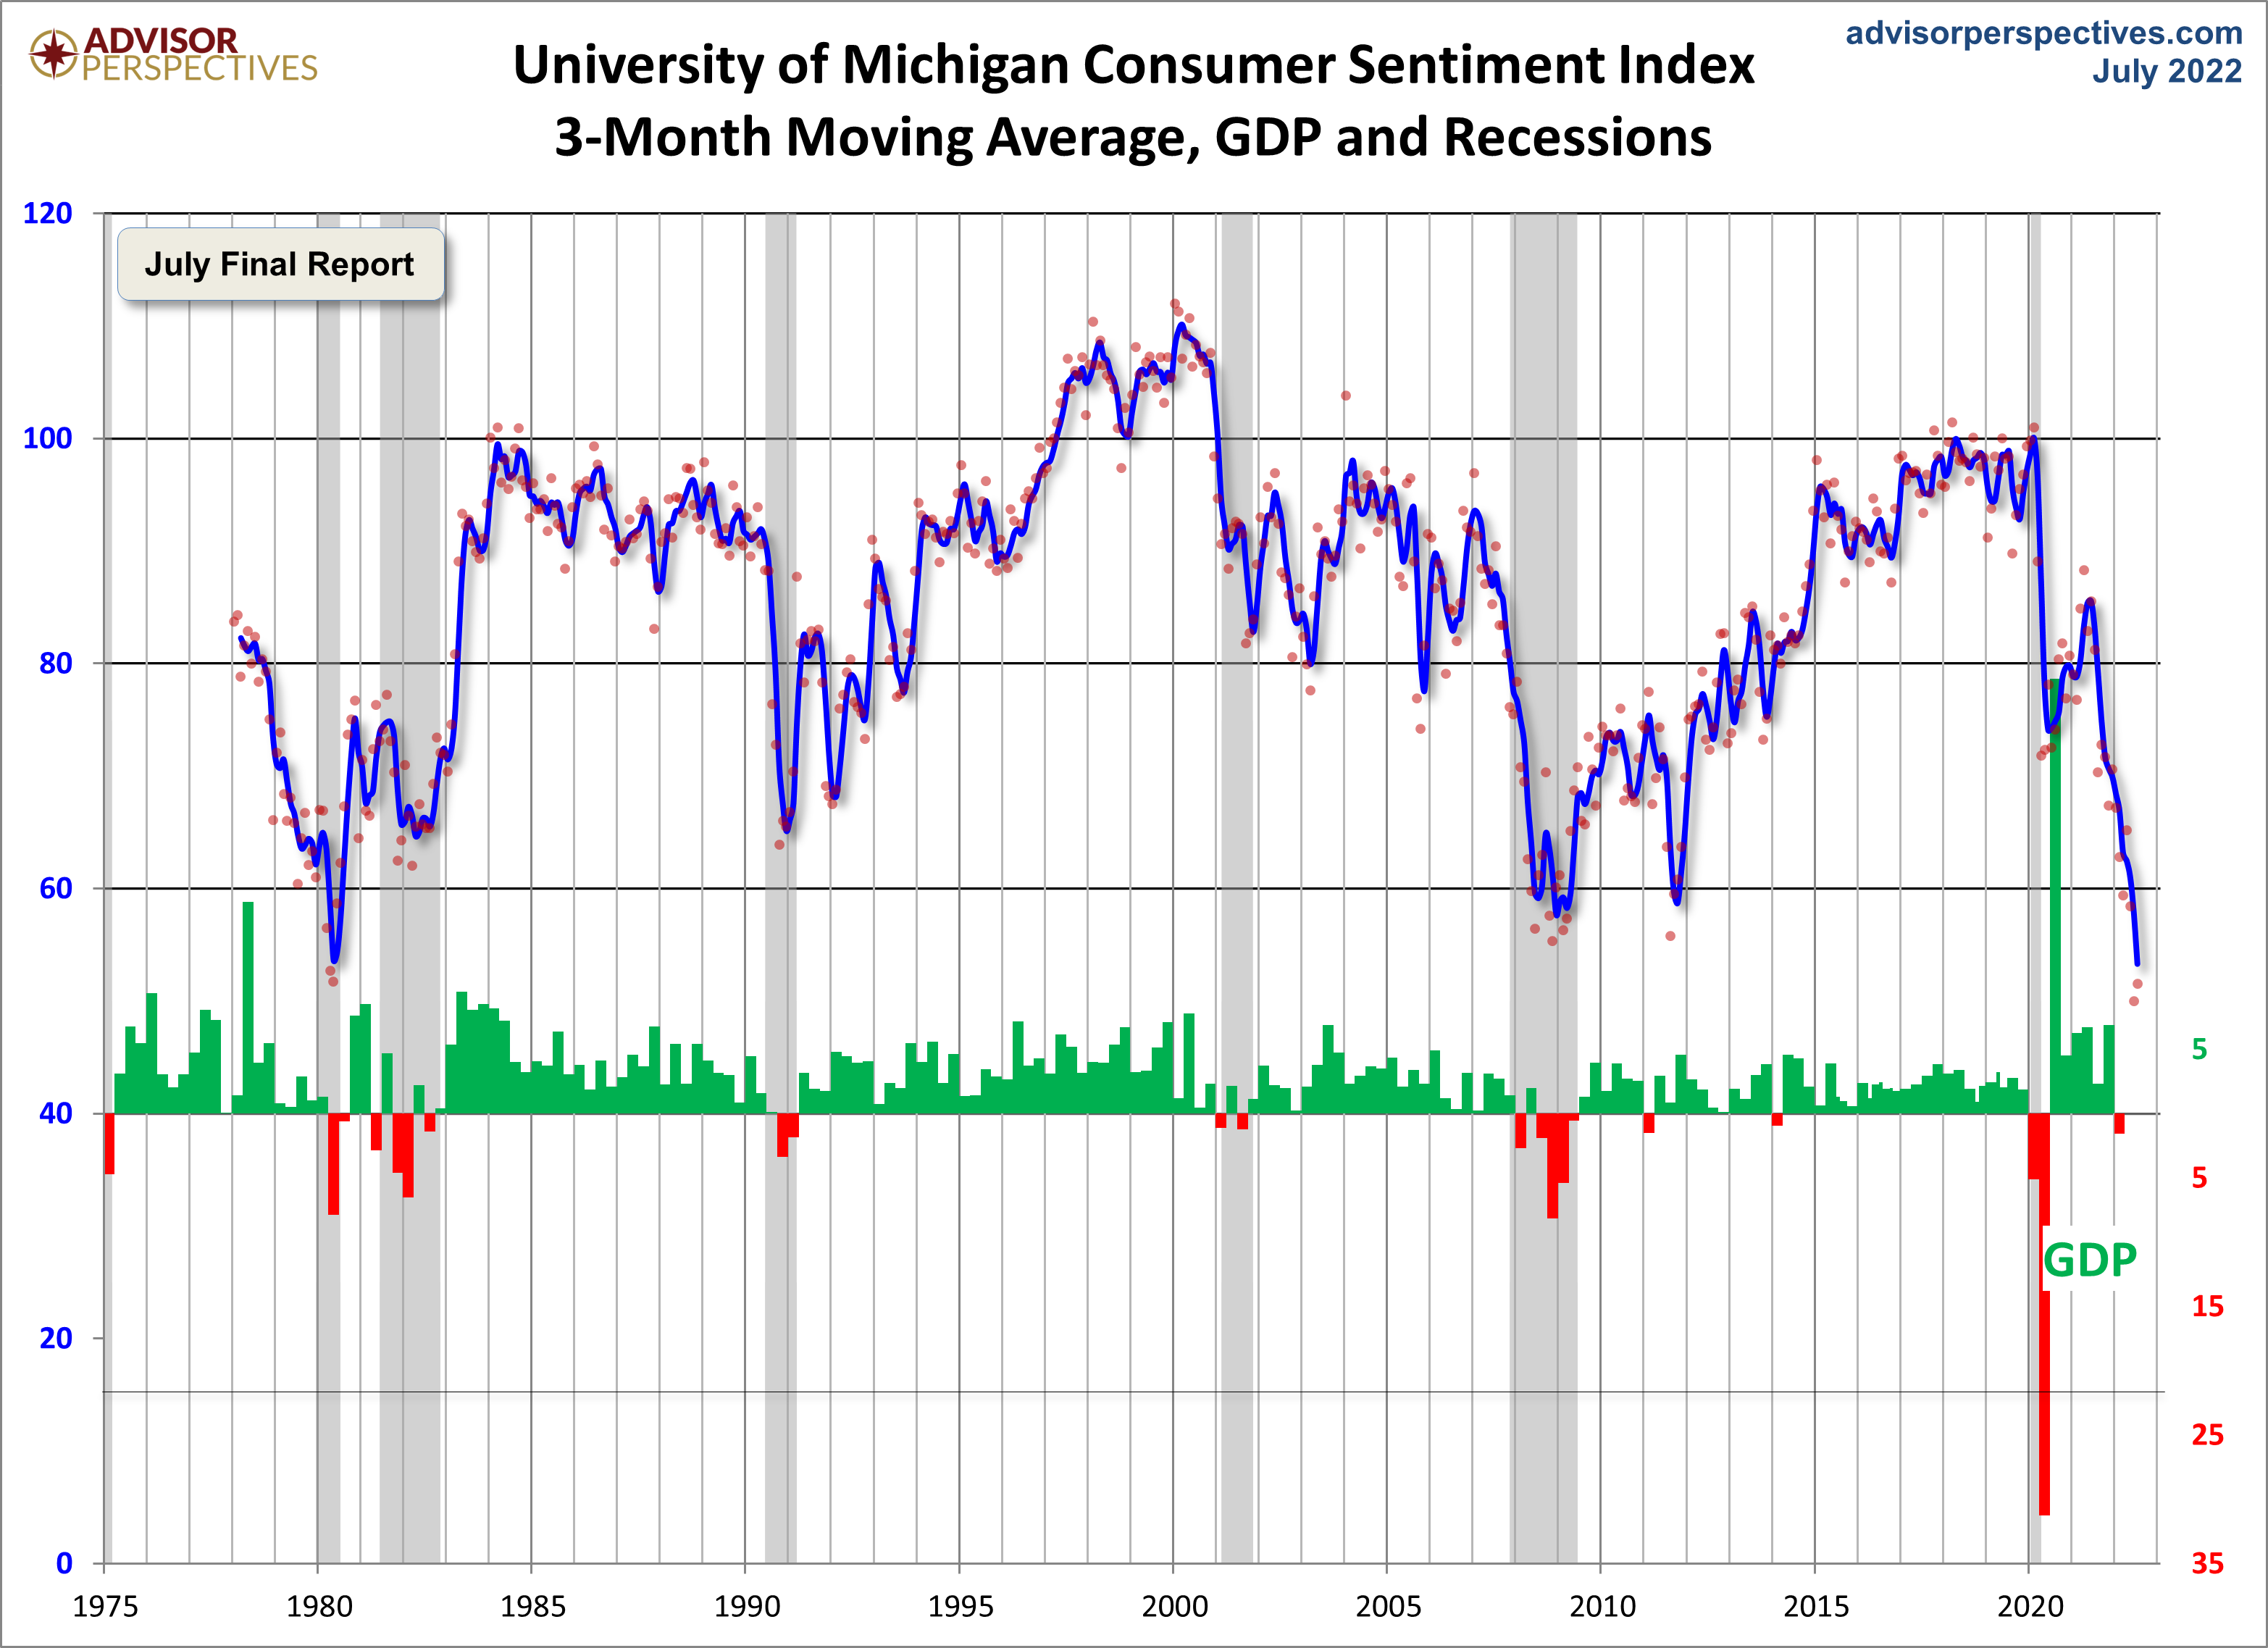
See the chart below for a long-term perspective on this widely watched indicator. Recessions and real GDP are included to help us evaluate the correlation between the Michigan Consumer Sentiment Index and the broader economy.

To put today's report into the larger historical context since its beginning in 1978, consumer sentiment is 39.9 percent below the average reading (arithmetic mean) and 39.1 percent below the geometric mean. The current index level is at the 0.1 percentile of the 535 monthly data points in this series.
Note that this indicator is somewhat volatile, with a 3.0 point absolute average monthly change. The latest data point saw a 1.5 point decrease from the previous month. For a visual sense of the volatility, here is a chart with the monthly data and a three-month moving average.
For the sake of comparison, here is a chart of the Conference Board's Consumer Confidence Index (monthly update here). The Conference Board Index is the more volatile of the two, but the broad pattern and general trends have been remarkably similar to the Michigan Index.

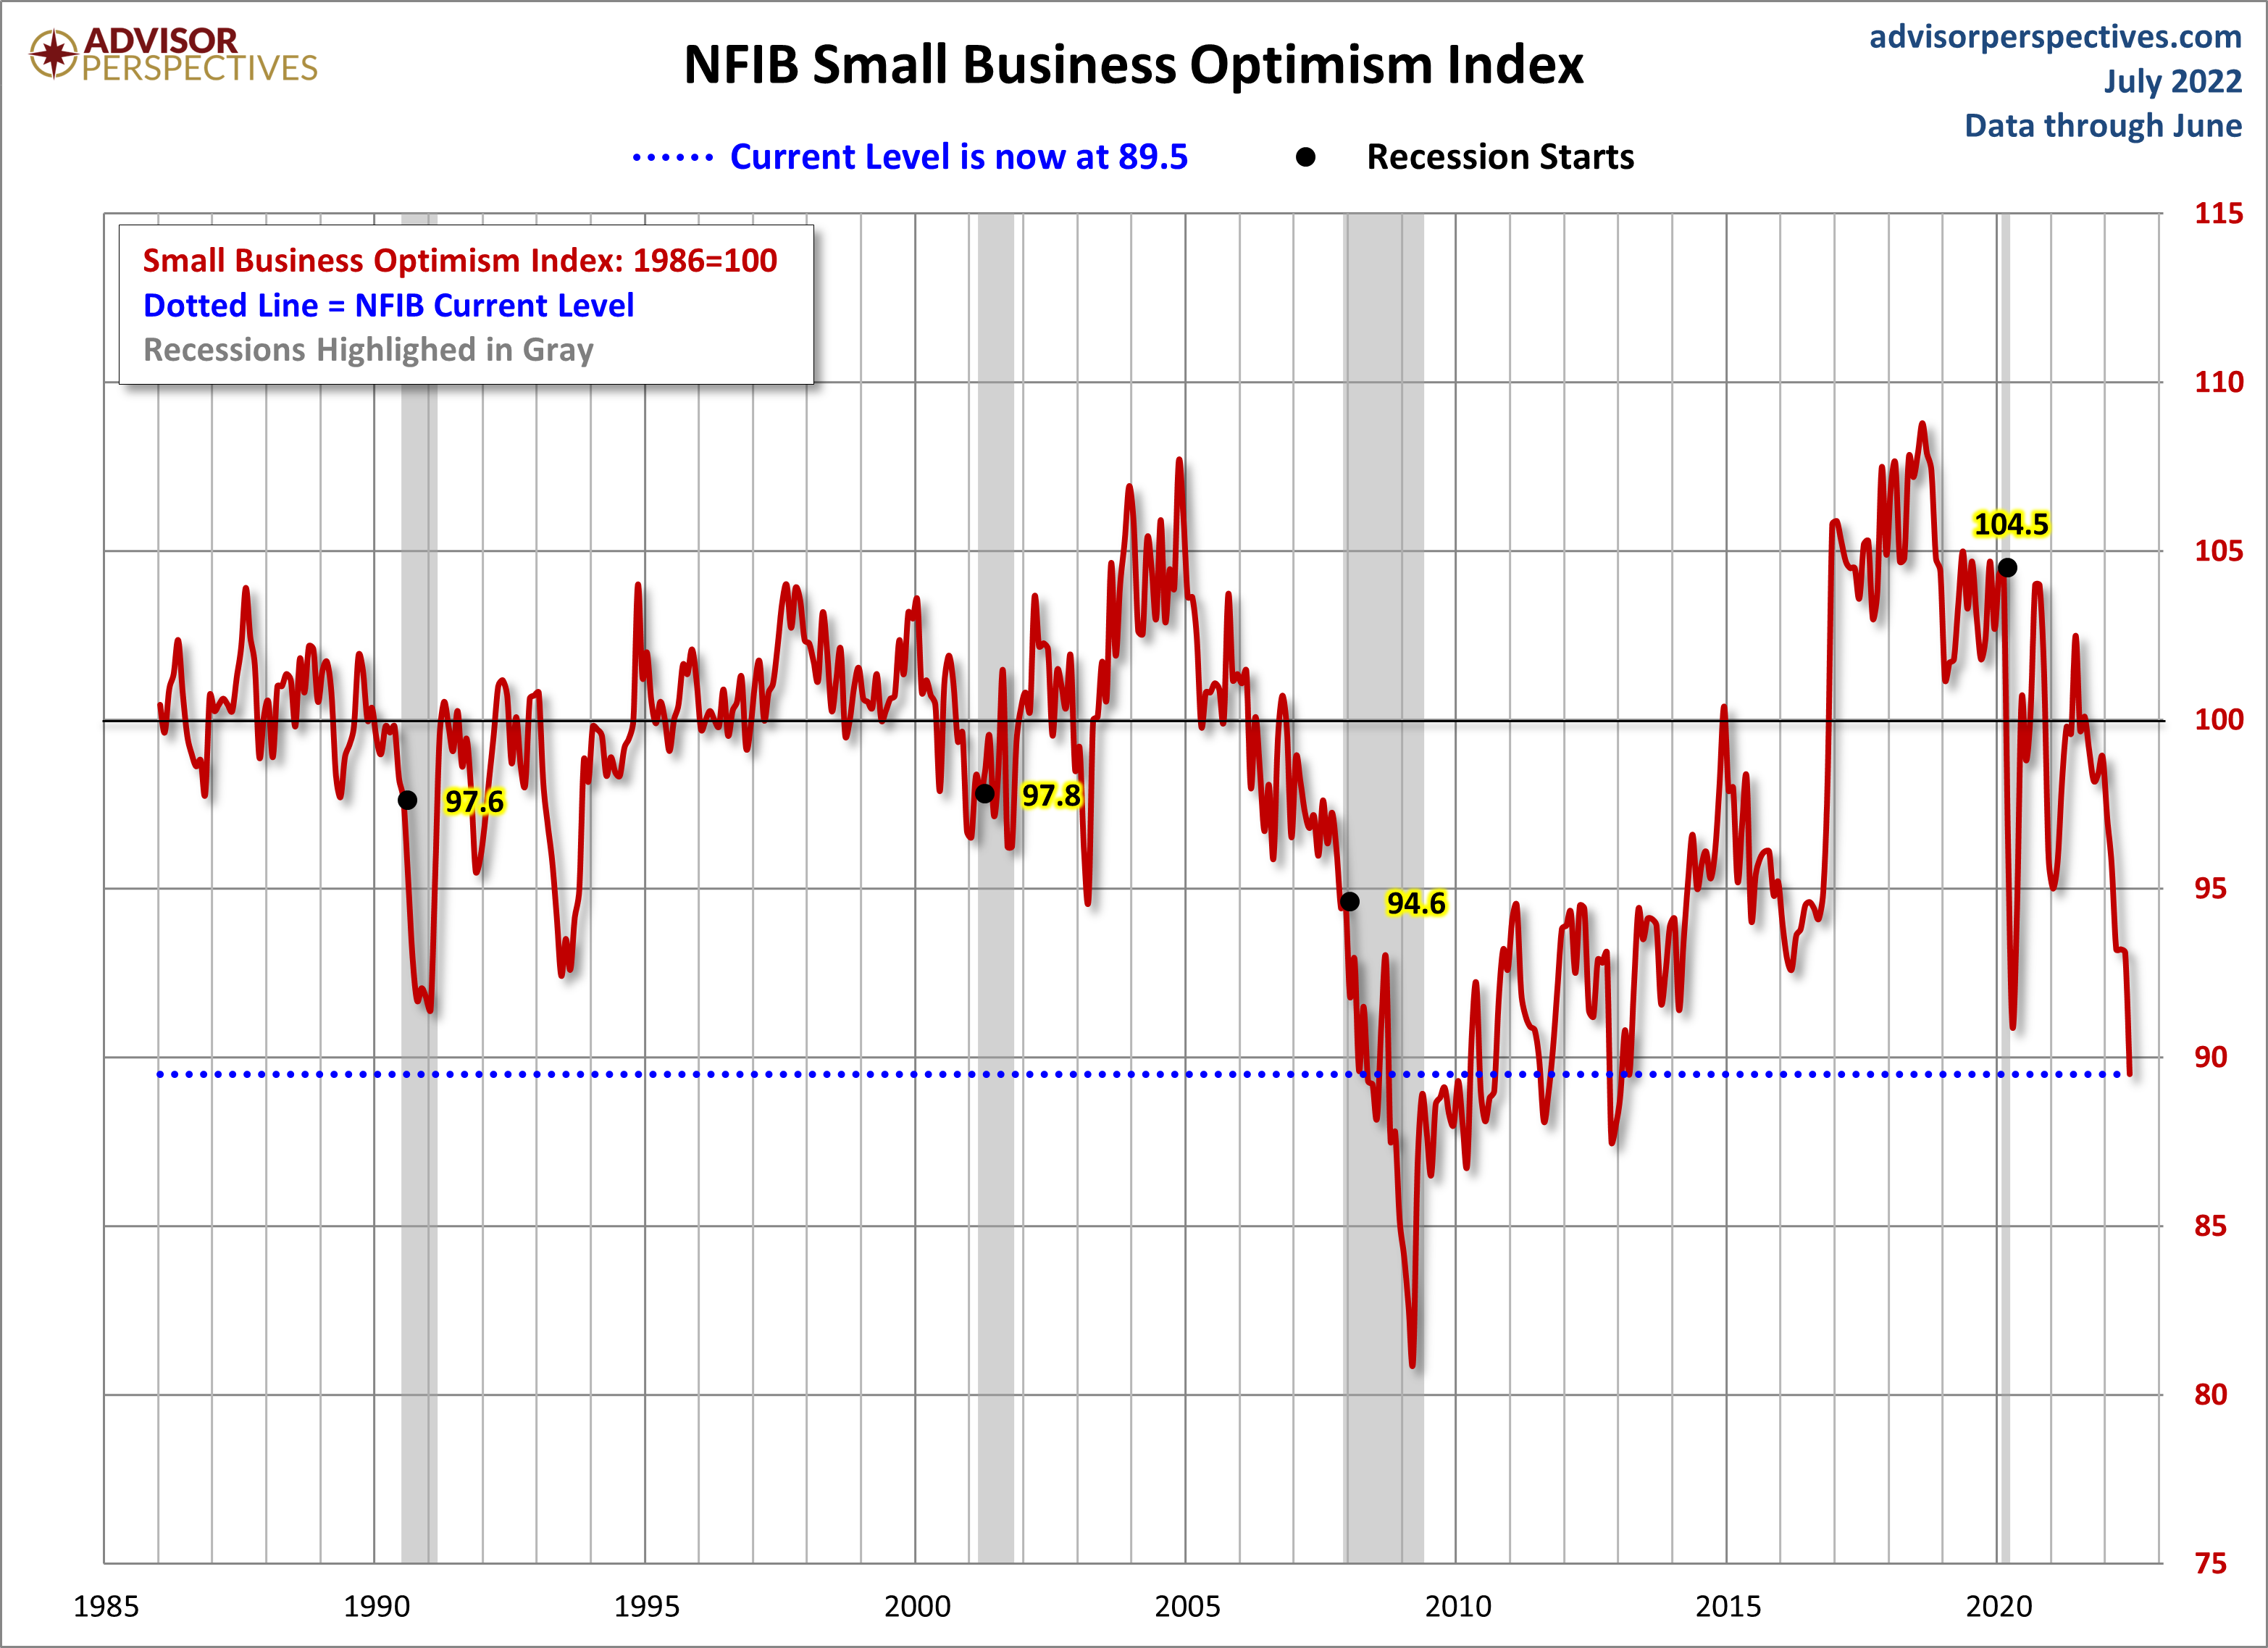
And finally, the prevailing mood of the Michigan survey is also similar to the mood of small business owners, as captured by the NFIB Business Optimism Index (monthly update here).
More By This Author:
ECRI Weekly Leading Index Update - Friday, July 29PCE Price Index: May Headline At 6.76% YoY
July Regional Fed Manufacturing Overview - Friday, July 29


Comments
Log in or sign up to join the conversation.